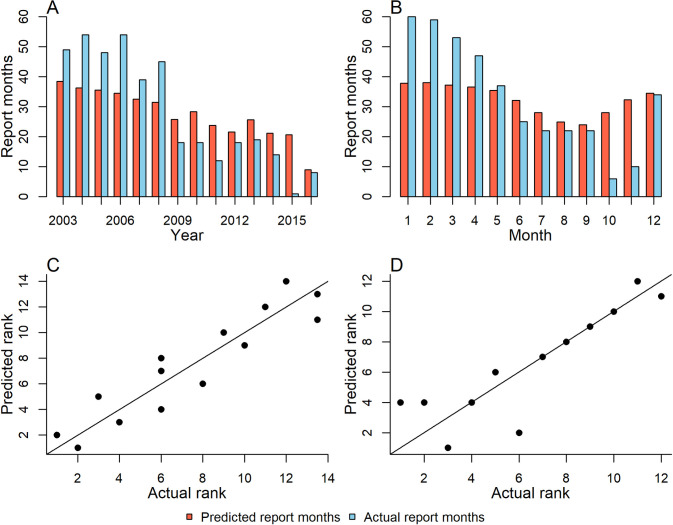
Fig 4.
Summed ensemble model predictions (points) for (A) each year for the interannual model (A), and for each month for the seasonal model (B), contrast against the actual summed report months (lines) for each year or month. Yearly (C) and monthly (D) predictions ranked against the actual report months for the interannual and seasonal models, respectively (lines show predicted = actual).

