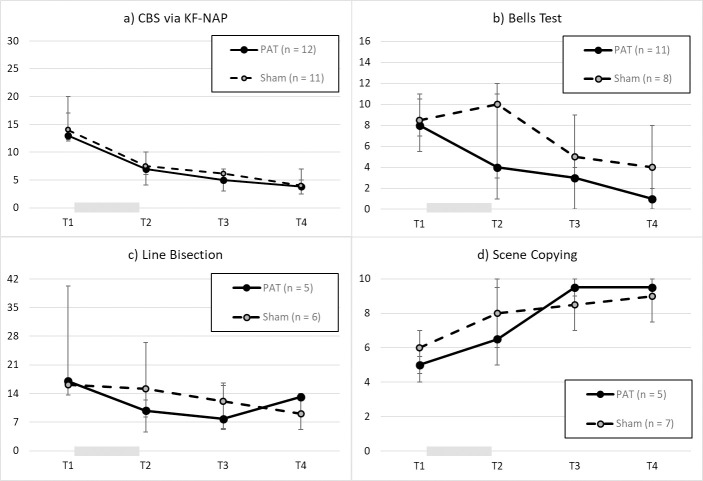
Fig 2.
Results, from T1 to T4, each two weeks apart, of a) CBS via KF-NAP, b) lateralized omission discrepancy in the Bells Test, c) deviation (mm) in line bisection, and d) accuracy score of the Scene Copying test. The gray bar between T1 and T2 indicates the treatment period. Each data point denotes the median with the error bar representing the IQR.

