
Figure 4. Signaling enriched in mesenchymal stem cells (MSCs) and WNT ligand enriched in transit amplifying cells (TACs).
(A) Wnt10a and Wnt5a are enriched in TACs. (B–E) RNAscope (red) of Wnt10a and Wnt5a in incisors from 1-month-old control mice. (F) Top eight signaling pathways enriched in MSCs identified by Ingenuity Pathway Analysis. Boxes in (B and D) are shown magnified in (C and E), respectively. Arrows indicate positive signal. The white dashed lines outline the cervical loop. The yellow dashed line outlines the MSC region. Scale bars, 100 μm.
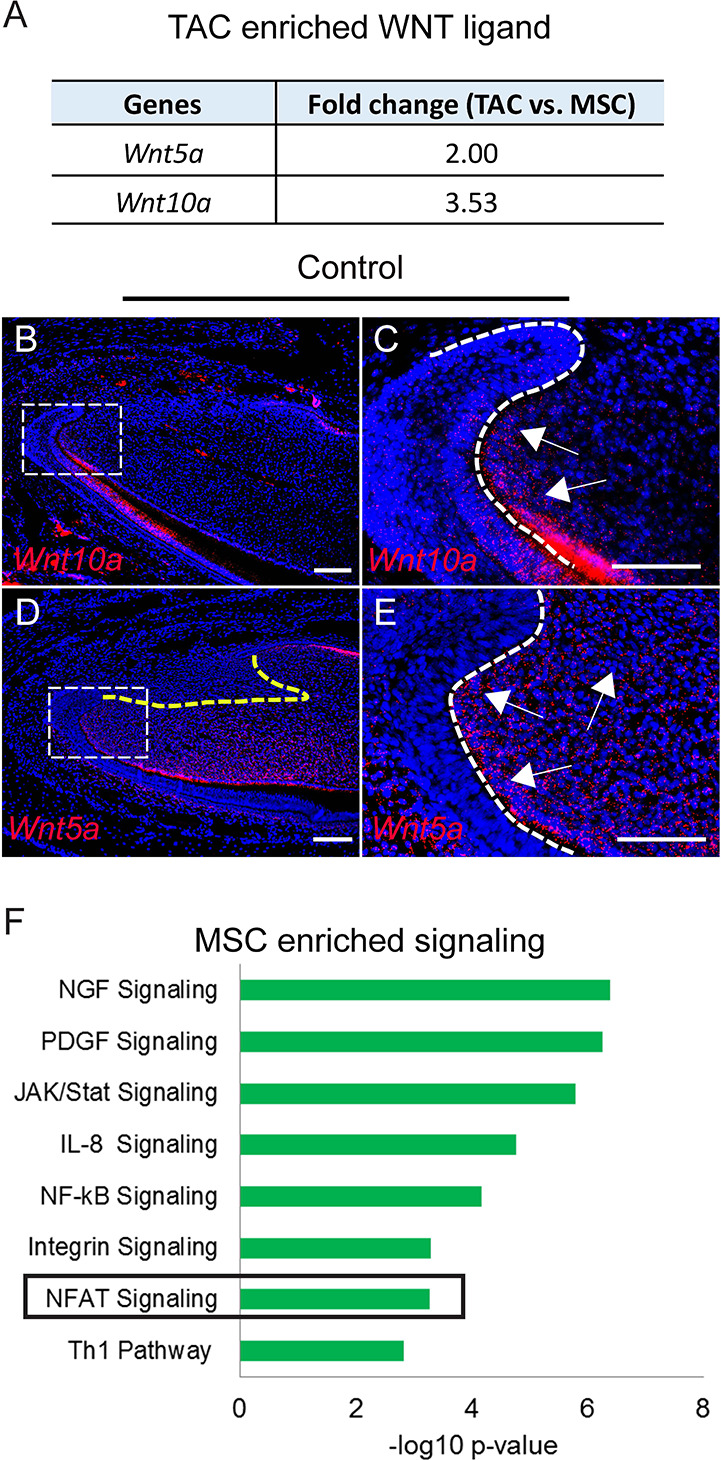
Figure 4—figure supplement 1. WNT ligand expression in adult incisors.

(A–Q’) RNAscope (red) of Wnt3a (A–A’), Wnt4 (B–B’), Wnt1 (C–C’), Wnt2 (D–D’), Wnt2b (E–E’), Wnt3 (F–F’), Wnt5b (G–G’), Wnt6 (H–H’), Wnt7a (I–I’), Wnt7b (J–J’), Wnt8a (K–K’), Wnt8b (L–L’), Wnt9a (M–M’), Wnt9b (N–N’), Wnt10b (O–O’), Wnt11 (P–P’), and Wnt16 (Q–Q’) in incisors of 1-month-old control mice. Boxes in (A–Q) are shown magnified in (A’–Q’), respectively. Insets in (A and B) show magnified images of the epithelium. The white dashed lines outline the cervical loop. Arrows indicate positive signal and asterisks indicate absence of signal. Scale bars, 100 μm.
Figure 4—figure supplement 2. Loss of WNT signaling in odontoblasts has no effect on mesenchymal stem cells (MSCs) or transit amplifying cells (TACs).

(A–D) H and E staining and Ki67 immunofluorescence (red) of incisors from 2-month-old Gli1-LacZ (control) and Dmp1-Cre;Wlsfl/fl;Gli1-LacZ mice (mutant). (E) Quantitation of the percentage of Ki67+ cells per higher magnification section (C and D) of Gli1-LacZ and Dmp1-Cre;Wlsfl/fl;Gli1-LacZ incisor mesenchyme. (F–I) β-gal staining (green) of incisors from 2-month-old Gli1-LacZ and Dmp1-Cre;Wlsfl/fl;Gli1-LacZ mice. (J) Quantitation of the percentage of Gli1+ cells per higher magnification section (H and I) of Gli1-LacZ and Dmp1-Cre; Wlsfl/fl;Gli1-LacZ incisor mesenchyme. Arrows indicate positive signal. The white dashed lines outline the cervical loop. All quantitative data are presented as mean ± SD. ns, no significance. Four mice with four sections within each mouse per group were used to quantify Ki67+ cells. Gli1+ cells in the proximal region between the two cervical loops were counted in the mouse incisor. Scale bars, 100 μm.
Figure 4—figure supplement 2—source data 1. Source data for Figure 4—figure supplement 2E and J.
elife-59459-fig4-figsupp2-data1.xlsx (8.6KB, xlsx)
Figure 4—figure supplement 3. Loss of Wls in transit amplifying cells (TACs) results in diminished TACs and mesenchymal stem cells (MSCs) in the incisors of Axin2-CreERT2;Wlsfl/fl;Gli1-LacZ mice.

(A and B) Wls immunofluorescence (red) and DAPI staining (blue) of incisors from 2-month-old Gli1-LacZ (control) and Axin2-CreERT2;Wlsfl/fl;Gli1-LacZ mice. (C and D) MicroCT images of incisors from 2-month-old Gli1-LacZ and Axin2-CreERT2;Wlsfl/fl;Gli1-LacZ mice induced with tamoxifen for 1 month. (E–H) Ki67 immunofluorescence (red) and RNAscope (red) of Fgf10 in incisors of 2-month-old control and Axin2-CreERT2;Wlsfl/fl;Gli1-LacZ mice. (I–L) β-gal staining (green) of incisors from 2-month-old Gli1-LacZ and Axin2-CreERT2;Wlsfl/fl;Gli1-LacZ mice. The white dashed lines outline the cervical loop. Arrow indicates positive signal and asterisk indicates absence of signal. Schematic at the bottom indicates induction protocol. Scale bars for (E and F), 2 mm; Scale bars for others, 100 μm.
Figure 4—figure supplement 4. WNT receptor expression in adult incisors.

(A–H) RNAscope (red) of Lrp5 (A and B), Fzd2 (C and D), Fzd4 (E and F), and Fzd6 (G and H) in incisors of 1-month-old control mice. Boxes in (A, C, E, and G) are shown magnified in (B, D, F, and H), respectively. Arrows indicate positive signal and asterisks indicate absence of signal. Scale bars, 100 μm.