. 2021 Jan 22;10:e63645. doi: 10.7554/eLife.63645

Figure 1. Dbf2-Mob1 transiently localizes to the nucleolus in late anaphase.

(A) Major components of the mitotic exit network (MEN) and their subcellular localization. (B) Fluorescence recovery after photobleaching (FRAP) analysis of Mob1-eGFP (A39695). Red circles indicate the area of photo-bleaching. Cells were grown and imaged at room temperature in SC medium + 2% glucose. Graph to the right represents average measurements of double normalized fluorescence intensities (n = 6 cells) after correcting for photo-bleaching during acquisition. Red curve is the average fit and shaded area represents standard deviation (SD) of the fits. Half recovery time t1/2 ± SD is indicated. (C) Localization of Mob1 during the cell cycle. A40257 (with Mob1-eGFP, Cfi1-mCherry and Spc42-mCherry) cells were grown at room temperature in SC medium + 2% glucose and imaged every minute for 2 hr. Arrows highlight the nucleolar localization. (D) Nucleolar localization of full-length (A39931) and N-terminally truncated (A39933 and A39935) Mob1. Cells were grown at room temperature in SC medium + 2% glucose and imaged every 3 min for 4 hr. Arrows highlight the nucleolar localization. (E) Enrichment of Mob1 (A41211, n = 62 cells), Mob1Δ78 (A41212, n = 60 cells), and Mob1Δ132 (A41213, n = 48 cells) at the daughter spindle pole body (dSPB; left) and in the nucleolus (right) as a function of cell cycle progression. Cells were grown at 25°C in SC medium + 2% glucose and imaged every 3 min for 4 hr. Single cell traces were aligned based on anaphase onset, as defined as spindle length >3 μm (Figure 1—figure supplement 1F, measured based on SPB marker Spc42-mCherry), and averaged. Solid lines represent the average, and shaded areas represent 95% confidence intervals. (F) Maximum enrichment of full-length Mob1 (WT) and truncated Mob1 (Mob1Δ78 and Mob1Δ132) in the nucleolus in anaphase of cells in (E). Solid lines represent the median. ****p<0.0001 by two-sided Wilcoxon rank sum test.

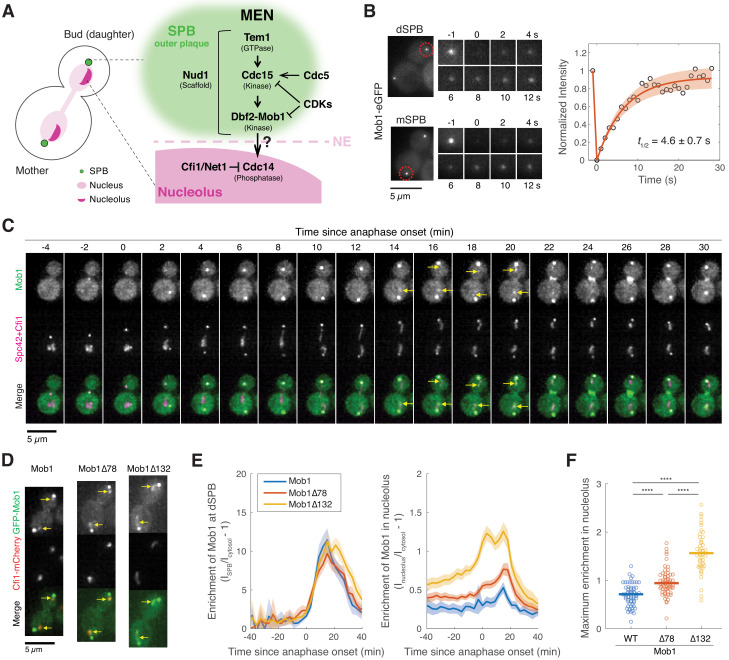
Figure 1.

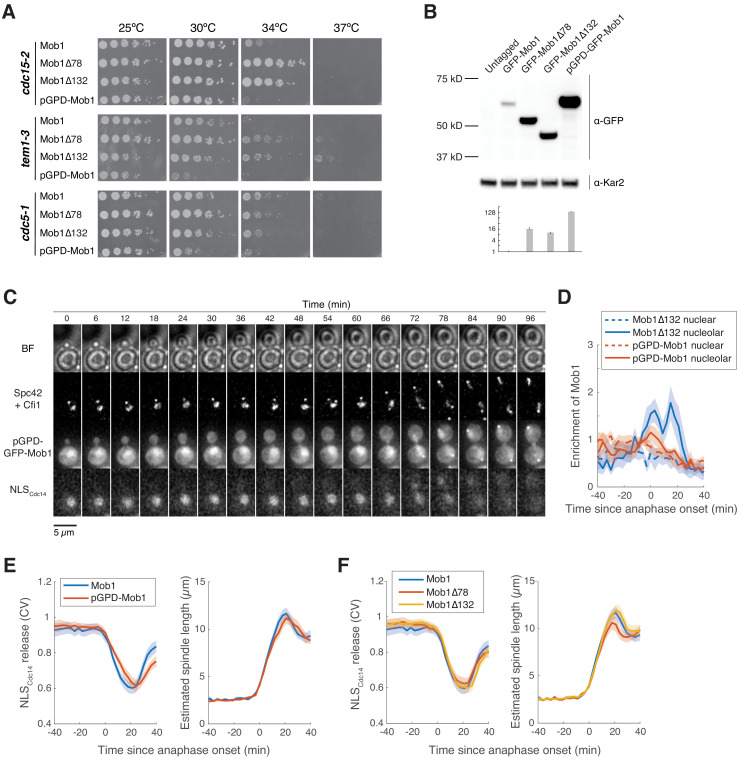
Figure 1—figure supplement 1. N-terminally truncated Mob1 is hyperactive.

Figure 1—figure supplement 1.

(A) Fivefold serial dilutions of cdc15-2 (A41424, A41425, A41426, A41427), tem1-3 (A41429, A41430, A41431, A41428), and cdc5-1 (A41432, A41433, A41434, A41435) harboring the indicated MOB1 constructs in YEP + 2% glucose at the indicated temperatures. (B) Immunoblot (top) and quantification (bottom) of untagged (A2587), full-length (A41351), and truncated GFP-Mob1 (A41352, A41353) as well as full-length GFP-Mob1 expressed from the pGPD/TDH3 promoter (A41350). (C) Localization of GFP-Mob1 expressed under the control of pGPD promoter (A41595) during the cell cycle. Cells were grown and imaged as in Figure 1E. Increased nuclear but not nucleolar localization of Mob1 was observed. (D) Enrichment of Mob1Δ132 (A41213, n = 14 cells) and pGPD-Mob1 (A41595, n = 17 cells) in the nucleolus (solid lines) compared to the nucleus (dashed lines) as a function of cell cycle progression. Cells were grown and imaged as in Figure 1E. (E) Kinetics of mitotic exit network (MEN) activation as measured by the release of NLSCdc14 reporter from the nucleus (see Figure 1—figure supplement 2) and anaphase progression as indicated by spindle length for cells harboring Mob1 (A41213, n = 62 cells) or pGPD-Mob1 (A41595, n = 43 cells). pGPD-Mob1 slightly delays MEN activation and exit from mitosis. (F) Kinetics of MEN activation and anaphase progression for experiments shown in Figure 1E. Mob1Δ78 slightly accelerated mitotic exit. For graphs in (D–F), single cell traces were aligned based on anaphase onset and averaged. Solid lines represent the average, and shaded areas represent 95% confidence intervals.

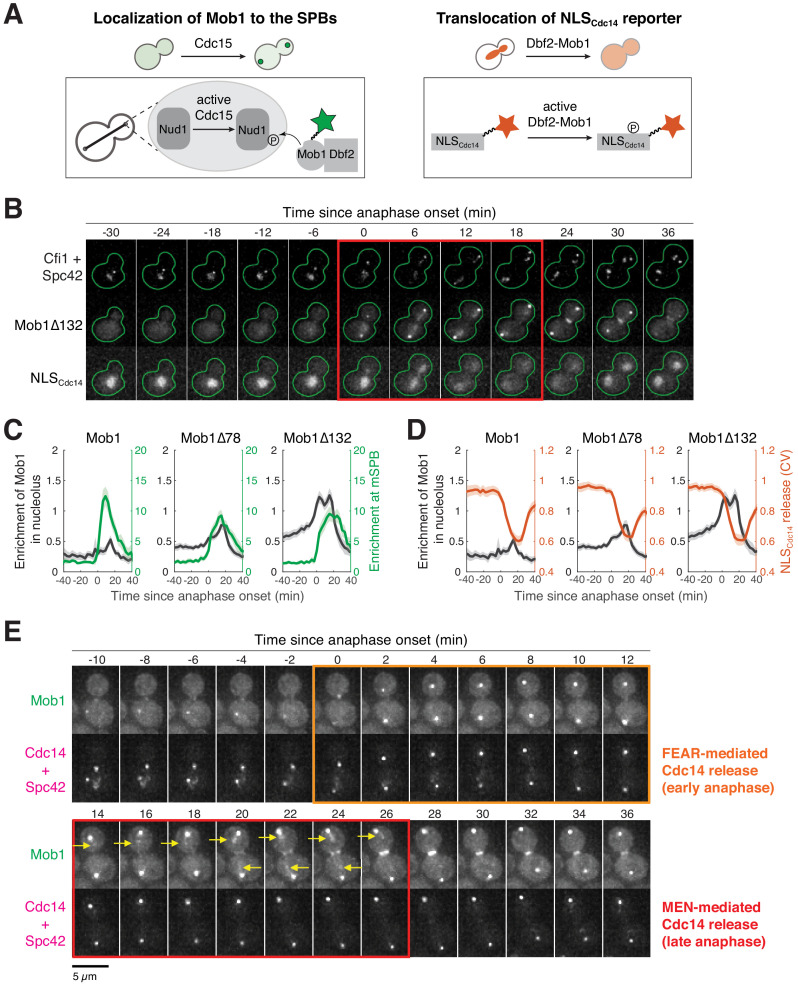
Figure 1—figure supplement 2. Mob1’s nucleolar localization correlates with mitotic exit network (MEN) activation and Cdc14 release from the nucleolus.

Figure 1—figure supplement 2.

(A) Illustration of Mob1’s spindle pole body (SPB) localization and translocation of NLSCdc14 reporter in response to MEN activation. (B) Localization of Mob1Δ132 and the MEN activity reporter NLSCdc14 during the cell cycle. A41213 (GFP-MOB1Δ132, CFI1/NET1-mCherry, SPC42-mCherry, and NLSCdc14-ymiRFP670) cells were grown as in Figure 1E. Red square indicates anaphase. (C) Relative timing of nucleolar localization of Mob1 (black) and SPB localization of Mob1 (green) in cells harboring the indicated MOB1 alleles. (D) Relative timing of nucleolar localization of Mob1 (black) and release of the NLSCdc14 reporter from the nucleus (red) in cells harboring the indicated MOB1 alleles. (E) Localization of Mob1 and Cdc14 during the cell cycle. A40314 (MOB1-eGFP, SPC42-mCherry, and CDC14-mCherry) cells were grown at room temperature in SC medium + 2% glucose and imaged every 2 min for 4 hr. The colored squares indicate the frames where Cdc14 is released from the nucleolus mediated by either the Cdc fourteen early anaphase release (FEAR) network or the MEN. Yellow arrows highlight localization of Mob1 in the nucleolus.