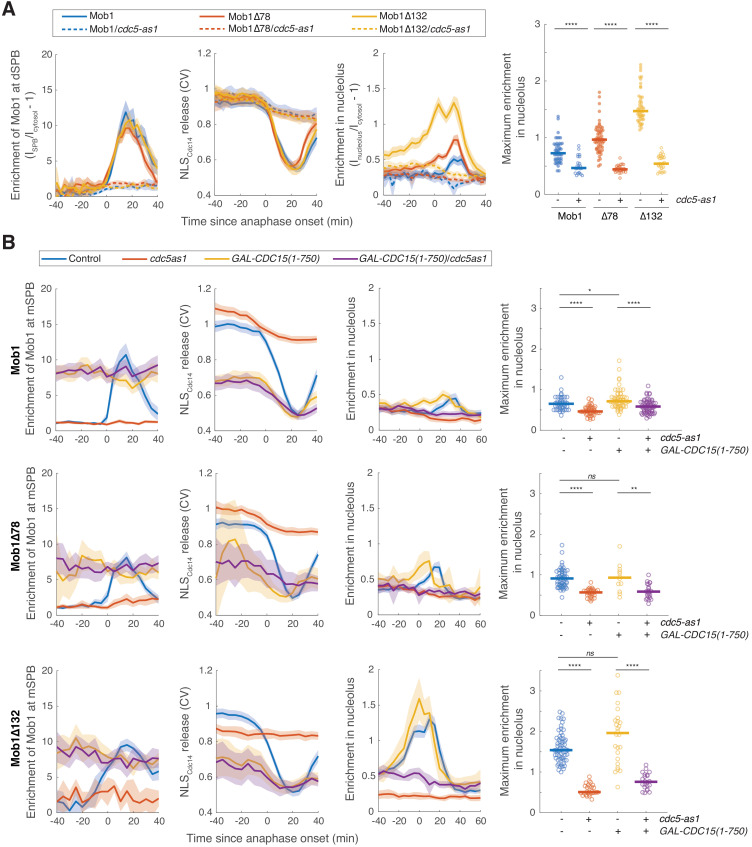
Figure 4. Nucleolar localization of Dbf2-Mob1 is regulated by CDC5 independently of CDC15.
(A) Enrichment of Mob1 at the daughter spindle pole body (dSPB), in the nucleolus, and Dbf2-Mob1’s kinase activity in cells wild type for CDC5 (A41211, A41212, and A41213; n = 49, 60, and 47 cells respectively) or harboring a cdc5-as1 allele (A41334, A41335, and A41336; n = 23, 30, and 28 cells respectively). Cells were grown at 25°C in SC medium + 2% glucose and 5 μM CMK and imaged every 3 min for 4 hr. (B) Cells harboring GAL-CDC15(1-750) and cdc5-as1 either containing eGFP-MOB1 (A41211, A41334, A41376, and A41337; n = 44, 41, 58, and 61 cells respectively), or eGFP-MOB1Δ78 (A41212, A41335, A41377, and A41338; n = 54, 30, 12, and 22 cells respectively), or eGFP-MOB1Δ132 (A41213, A41336, A41378, and A41339; n = 62, 28, 26, and 22 cells respectively) were analyzed to determine Mob1 localization. Localization to the mother SPB (mSPB) instead of dSPB was quantified here because cells expressing GAL-CDC15(1-750) often exit from mitosis in the mother (without movement of a SPB into the bud). For cells exited with two SPBs in the mother cell, maximum intensities of the two SPBs were used. Cells were grown at 25°C in SC medium + 1% raffinose, 1% galactose, and 5 μM CMK and imaged every 5 min for 5 hr. Solid lines represent the average of single cell traces aligned to anaphase onset. Shaded areas represent 95% confidence intervals. For maximum enrichment, each dot represents a single cell. Solid lines represent the median. ****p<0.0001; **p<0.01; *p<0.05 by two-sided Wilcoxon rank sum test.


