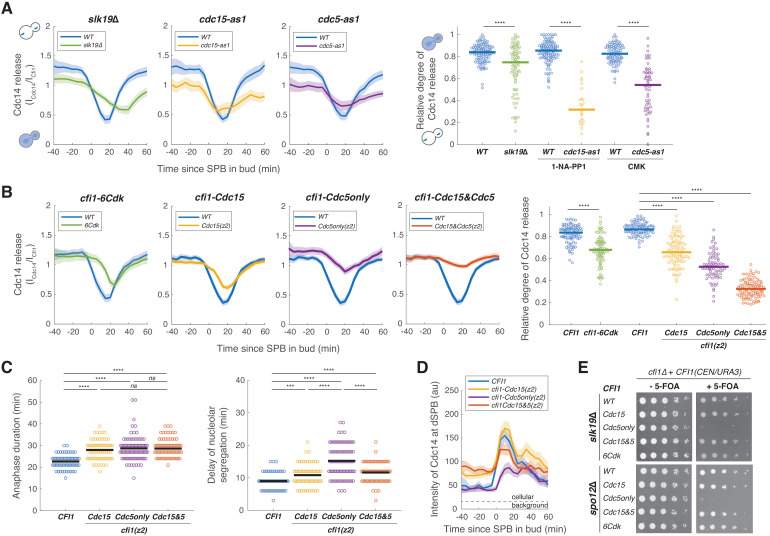
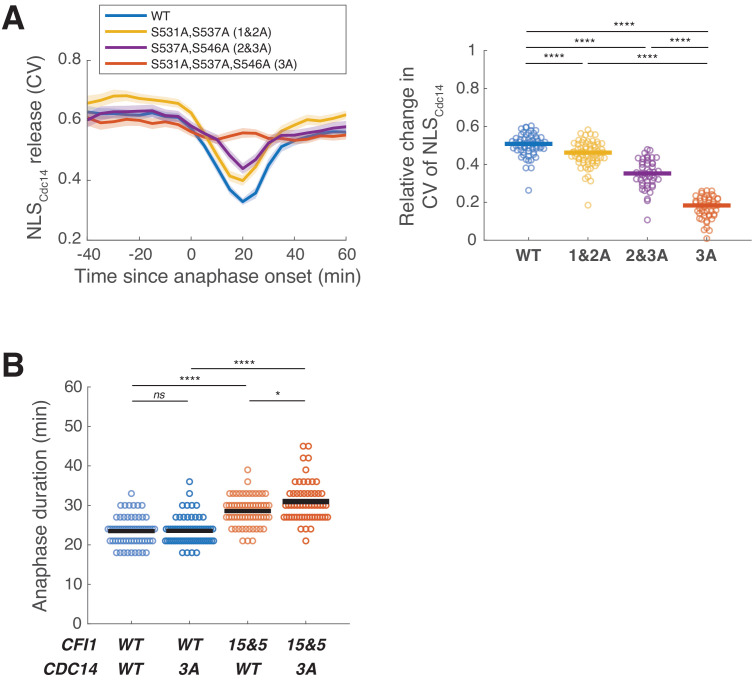
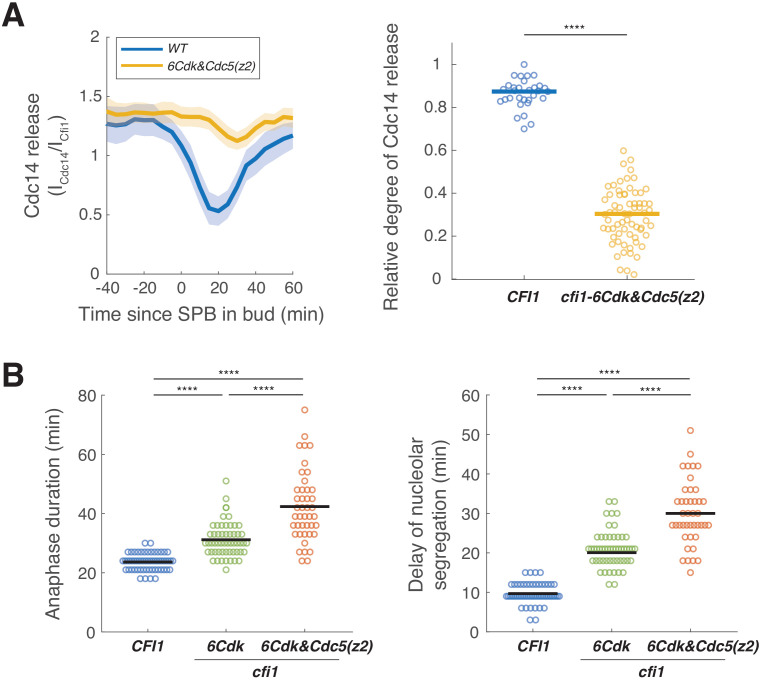
Figure 6. Mitotic exit network (MEN) and Cdc5 promote release of Cdc14 from the nucleolus by phosphorylating Cfi1/Net1.
(A) Cdc14 nucleolar release kinetics in wild-type (A41387, n = 134, 123, and 96 cells for each condition), slk19Δ (A41410, n = 86 cells), cdc15-as1 (A41408, n = 38 cells), or cdc5-as1 mutant (A41409, n = 61 cells). Cells were grown at 25°C in SC medium + 2% glucose with corresponding inhibitors and imaged every 5 min for 5 hr. Release of Cdc14 from the nucleolus was quantified as the ratio of fluorescence intensity of Cdc14-eGFP to Cfi1/Net1-mScarlet-I in the nucleolus (ICdc14/ICfi1). Relative degree of Cdc14 release from the nucleolus was calculated with the normalized minimal Cdc14 level in the nucleolus as 1 - (ICdc14(tmin)/ICfi1(tmin))/ (ICdc14(t-20)/ICfi1(t-20)), where tmin represents the frame with minimal Cdc14 level in the nucleolus and t-20 represents 20 min before movement of the spindle pole body (SPB) into bud. (B) Cdc14 nucleolar release kinetics in cells harboring wild-type CFI1/NET1 (A41387, n = 102 and 114 cells) or CFI1/NET1 phospho-mutants for CDK sites (A41420, n = 95 cells), Cdc15 sites (A41587, n = 104 cells), Cdc5 sites (A41588, n = 86 cells), and Cdc15&Cdc5 sites (A41589, n = 131 cells). Cells were grown at 25°C in SC medium + 2% glucose and imaged every 5 min for 5 hr. (C) Distribution of anaphase duration and relative delay of nucleolar segregation for different CFI1/NET1 phospho-mutants (A41436, A41590, A41591, and A41592; n = 76, 85, 99, and 92 cells respectively) measured using the SPB marker Spc42-eGFP and the nucleolar marker Cfi1/Net1-mScarlet-I (see Figure 6—figure supplement 3 for details). Cells were grown at 25°C in SC medium + 2% glucose and imaged every 3 min for 4 hr. (D) Intensities of Cdc14-eGFP at dSPBs in different CFI1/NET1 phospho-mutant cells (A41387, A41587, A41588, and A41589; n = 80, 82, 77, and 89 cells respectively). Cells were grown and imaged as in (B). (E) Genetic interactions between different CFI1/NET1 phospho-mutants and slk19Δ (A41645, A41646, A41647, A41648, A41649) or spo12Δ (A41650, A41651, A41652, A41653, A41654) analyzed by plasmid shuffling (see Materials and methods for details). Fivefold serial dilutions were spotted onto plates with or without 5’-fluoroorotic acid (5-FOA) and incubated at 25°C for 2–3 days. The presence of 5-FOA selects cells that are viable after losing the CFI1(URA3/CEN) plasmid. For all graphs, single cell traces were aligned to the frame where the dSPB entered the bud and averaged. Solid lines represent the average. Shaded areas represent 95% confidence intervals. For distributions, each dot represents a single cell. Solid lines represent the median for (A and B) and the mean for (C). ****p<0.0001; ***p<0.001; **p<0.01; *p<0.05 by two-sided Wilcoxon rank sum test.

