Figure 4.
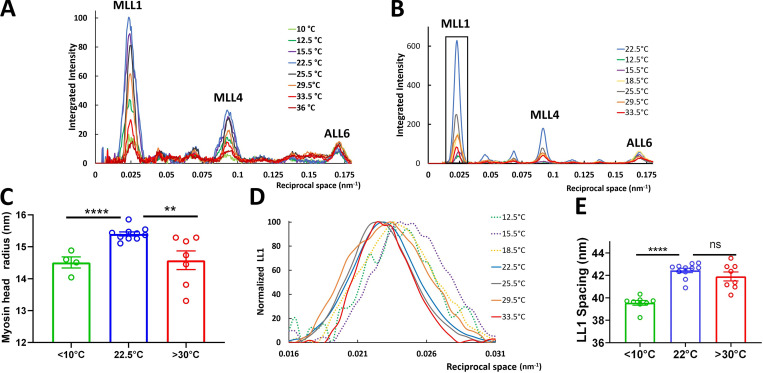
Intensities of off-meridional layer lines from XRD patterns of relaxed tarantula skeletal muscle. Integration area shown in Fig. 2 A, green box. (A and B) Example intensity traces from leg muscles in one leg ex vivo (A) and isolated live muscle (B). (C) Myosin head radius calculated from MLL4 profiles for temperatures <10°C, 22.5°C, and >30°C. (D) Normalized off-meridional axial profiles of the first MLL (LL1) parallel to meridian (boxed area in B), showing a shift of the first peak only at low temperature. (E) Peak LL1 spacings of the MLL1 profiles shown in D for temperatures <10°C, 22.5°C, and >30°C. The results are given as mean ± SEM. ns, not significant; **, P < 0.01; ****, P < 0.0001; two-tailed unpaired Student’s t tests.

