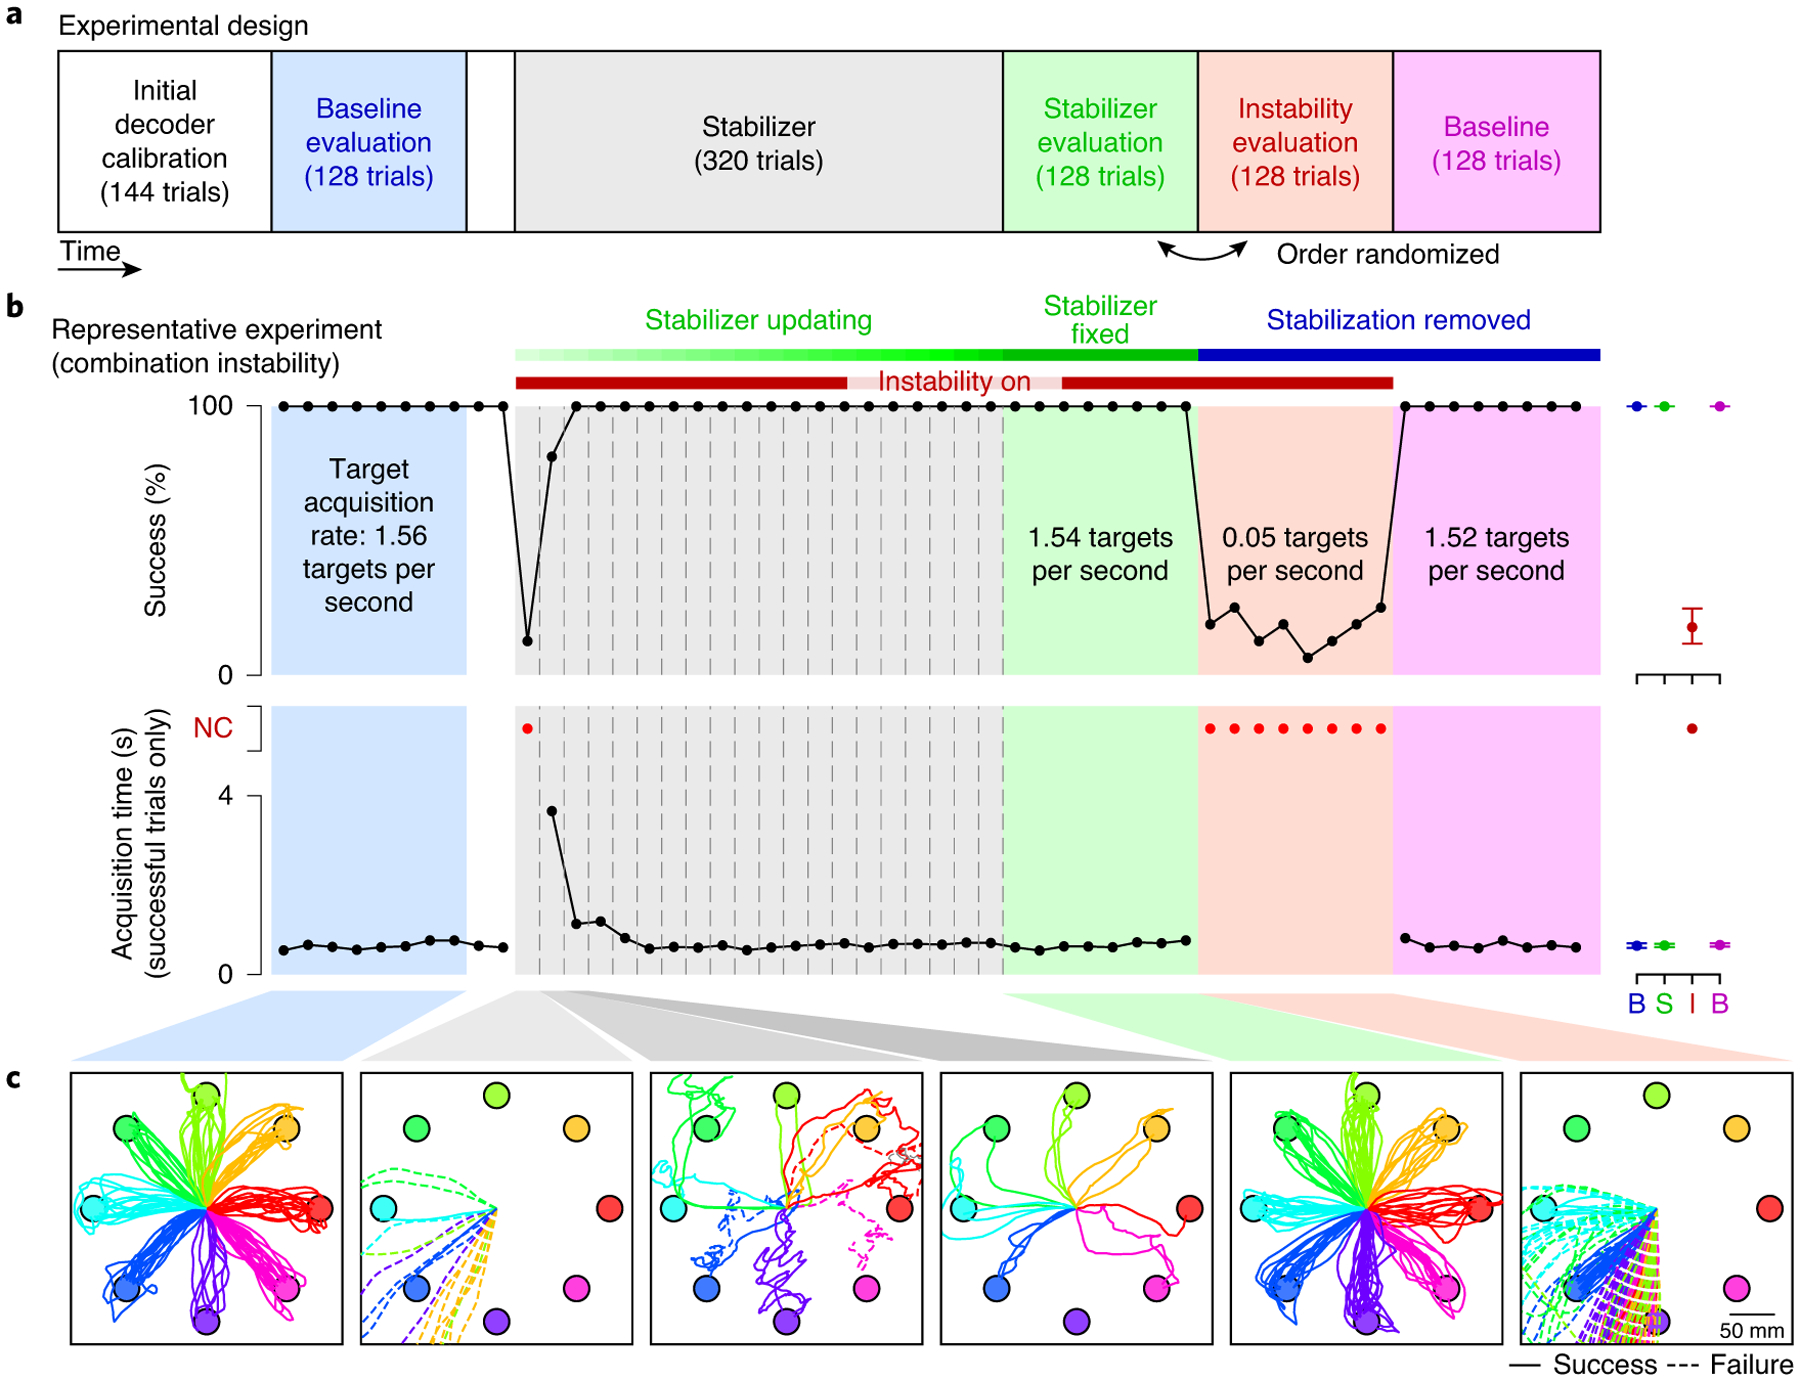
Fig. 4 |. Representative experimental session.

a, Experimental sessions began with calibration of the initial BCI decoder, followed by a baseline evaluation trial block (blue). An instability was then applied to the neural activity and the stabilizer was turned on and allowed to run for approximately 320 trials. The stabilizer updates were then turned off, and the performance of the stabilized BCI was evaluated (green). To assess performance in the presence of the instability alone, the animals also performed a block of trials with the non-stabilized BCI decoder in the presence of the instability (red). A final baseline block with the non-stabilized BCI decoder and no instability was performed at the end of each experimental session (magenta). This was done to determine whether there were any transient changes in baseline performance (that is, after-effects) following stabilization that may be indicative of learning by the animal. b, Cursor control success rate and acquisition times for a representative experiment (L20160325). Vertical dashed lines represent stabilizer updates. Black dots represent success rate and acquisition time averaged over non-overlapping sets of 16 trials for all blocks except the stabilizer block. For this block, black dots represent success rate and average acquisition time calculated using all trials between stabilizer updates, which occurred nominally every 16 trials. Acquisition times for blocks with success rates of <50% were not quantified and are instead represented as red dots. For visual clarity, average success rates and acquisition times for the evaluation blocks are shown to the right of each trace. B (blue), baseline evaluation; B (magenta), post-stabilization baseline; I, instability evaluation; NC, not computed; S, stabilizer evaluation. Error bars represent the 95% confidence interval of the mean. c, Cursor trajectories during selected blocks for experiment L20160325. Successful trials are shown by solid lines, and failed trials by dashed lines.
