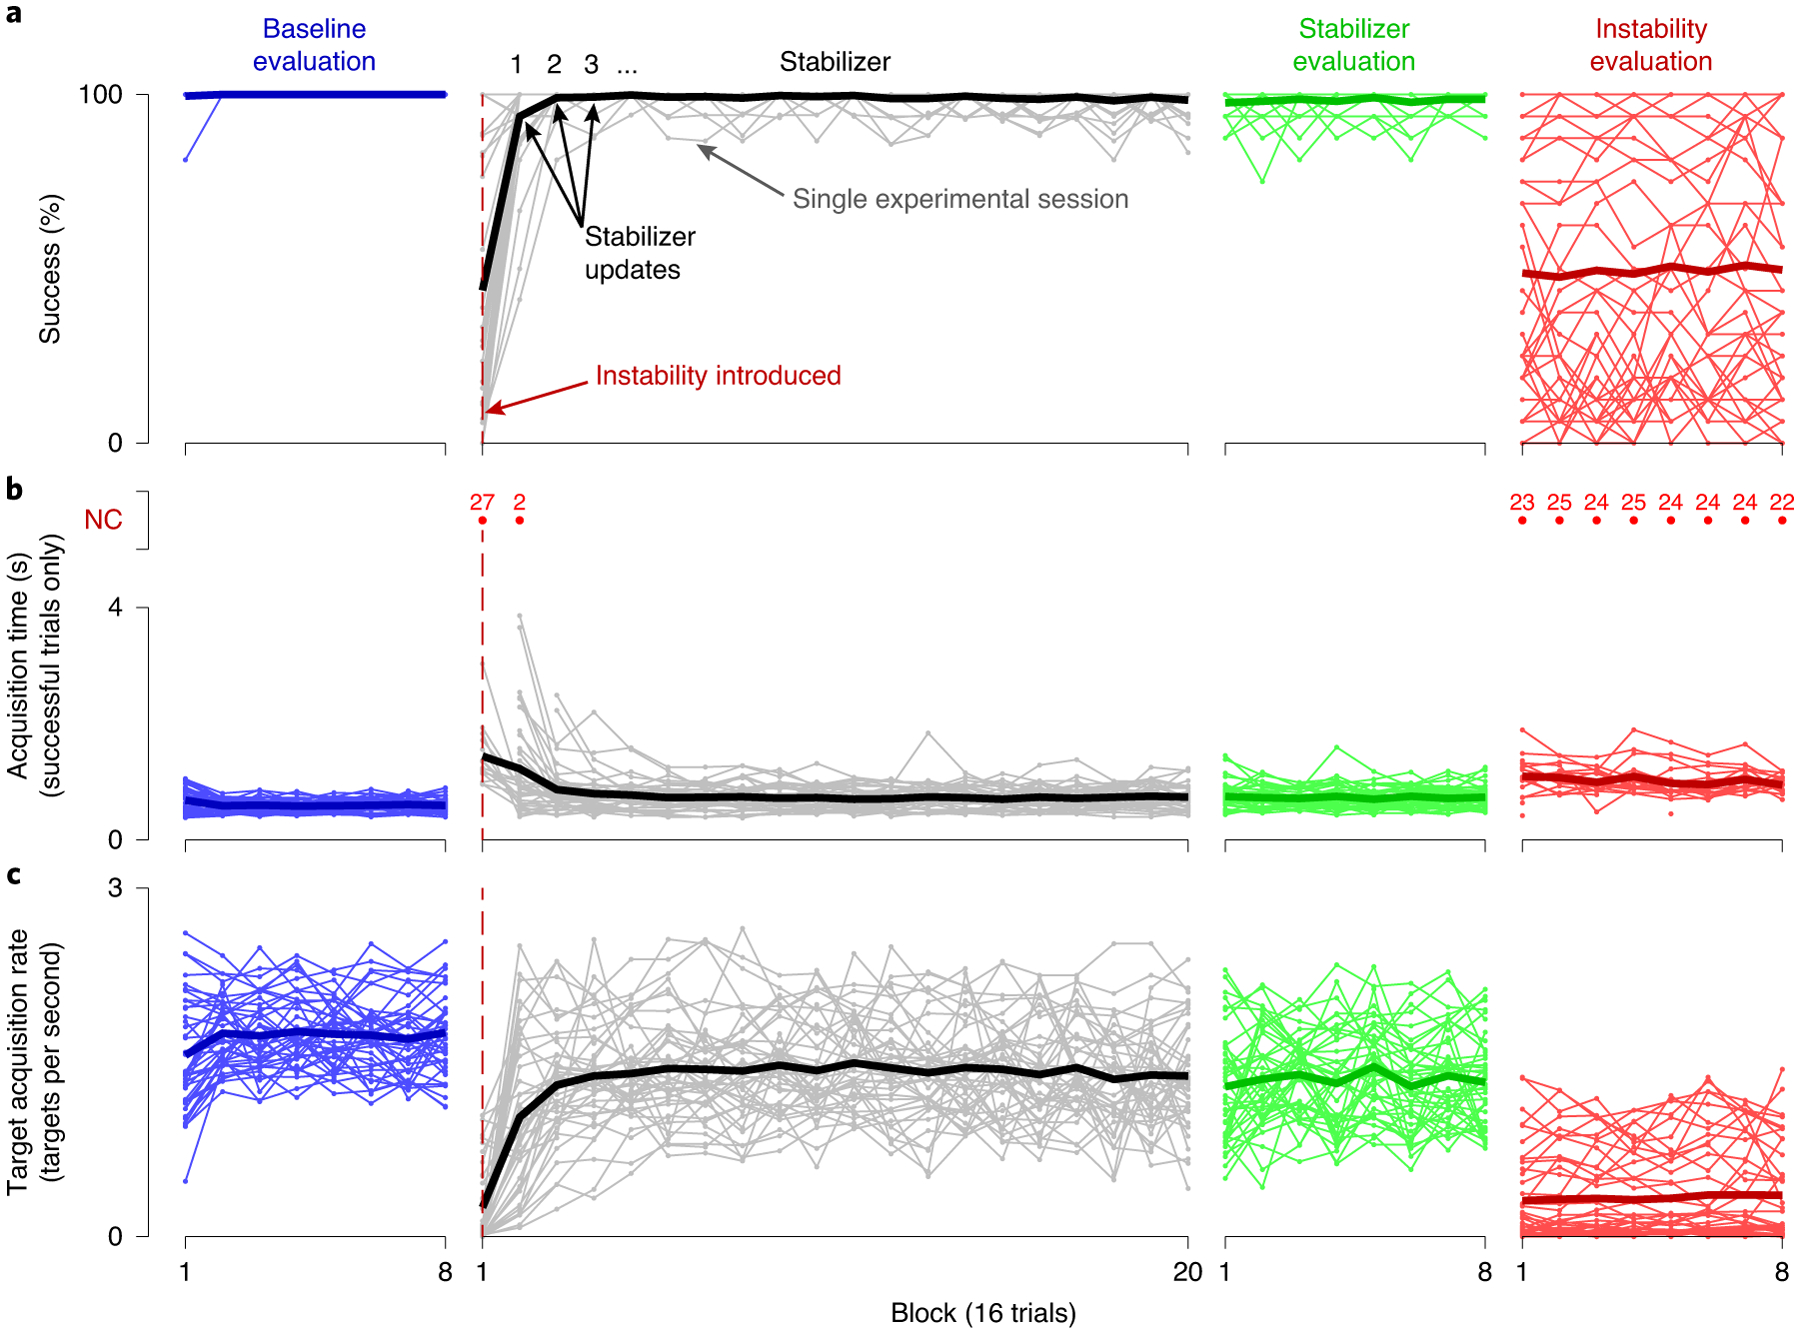
Fig. 5 |. Summary of the single-day experimental sessions.

a–c, Success rate (a), mean acquisition time (b) and TAR (c), calculated over 16-trial blocks, are shown for all single-day experimental sessions for both monkeys. Blue lines indicate performance metrics calculated for the baseline evaluation block immediately following calibration of the BCI decoder. Grey lines indicate performance metrics calculated while stabilizer updates were occurring. Green lines indicate performance metrics calculated during the stabilizer evaluation block, when the stabilizer was held fixed. Red lines indicate performance metrics calculated during the instability evaluation block, when BCI control was performed using the non-stabilized decoder. Thin lines indicate the results for individual experiments, whereas thick lines indicate the mean across experiments. Acquisition times for blocks with success rates of <50% are plotted as red dots, with the number of experiments for which the acquisition time could not be computed for a given block shown above each red dot. Acquisition times for these blocks are not included in the average across experiments. As in Fig. 4, performance metrics for the stabilizer block were calculated for all trials between stabilizer updates, which occurred nominally every 16 trials.
