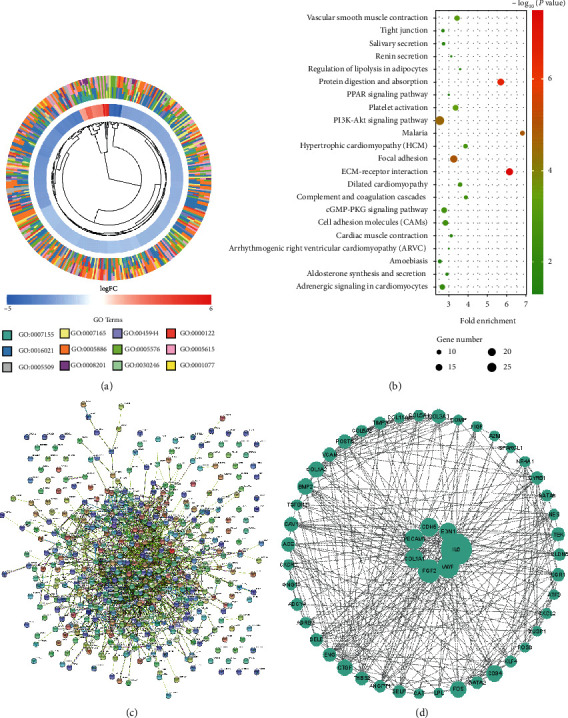
Figure 3.

Function enrichment analysis and protein-protein interaction (PPI) of candidate differentially expressed genes (DEGs). (a) Cluster plot of Gene Ontology (GO) terms; the fold change of genes is depicted in color (blue: low expression, red: high expression); the GO terms are visualized in different colors. (b) Bubble plot of Kyoto Encyclopedia of Genes and Genomes (KEGG) pathways; the x-axis indicates fold enrichment level; the y-axis shows terms of pathways; the bubble size indicates the number of genes in the pathway; the significance level (P value) was ranked and colorized. (c) The PPI of DEGs obtained from the STRING database. (d) Top 50 hub DEGs were collected and visualized using Cytoscape (the size of circles represents the scores of “degree”).
