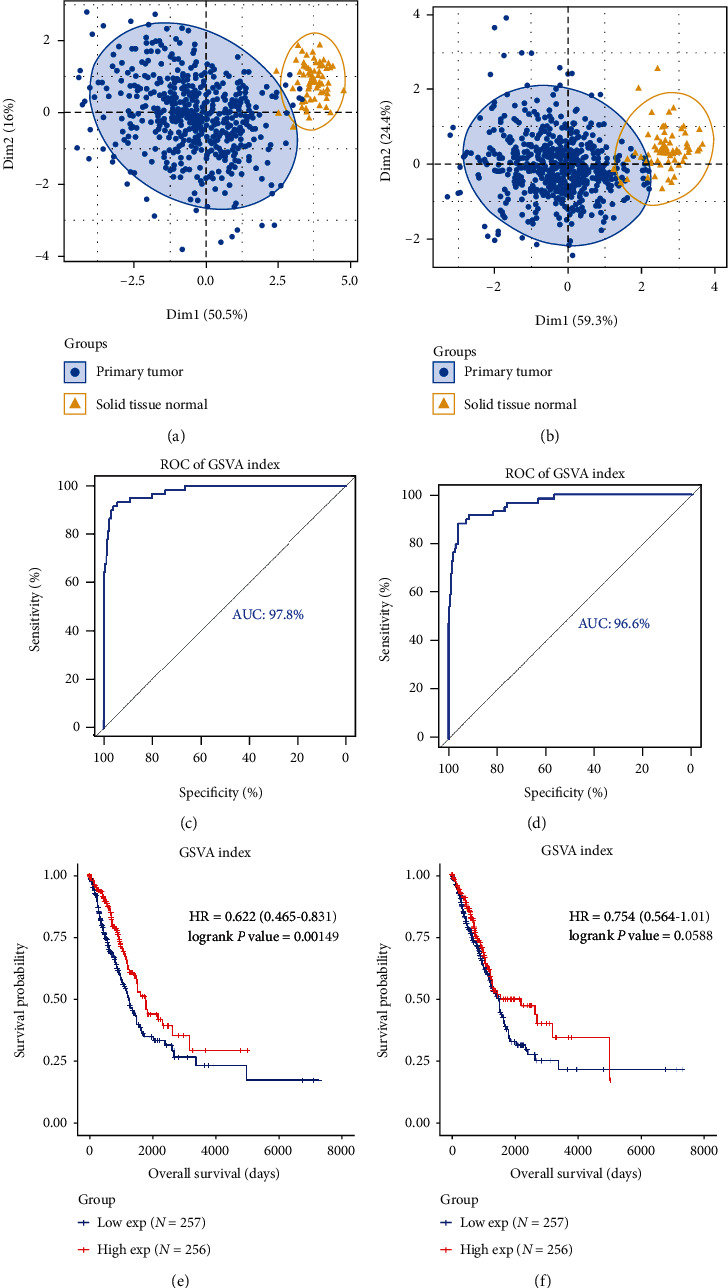
Figure 8.

Efficacy of seven candidate long noncoding RNAs (lncRNAs) as biomarkers. (a, b) Principal component analysis (PCA) plot is based on the expression of seven candidate lncRNAs and three lncRNAs with independent prognostic values. The receiver operating characteristic (ROC) curve of the Gene Set Variation Analysis (GSVA) index of candidate lncRNAs (c, d) and Kaplan-Meier survival plot of the GSVA index (e, f) is depicted.
