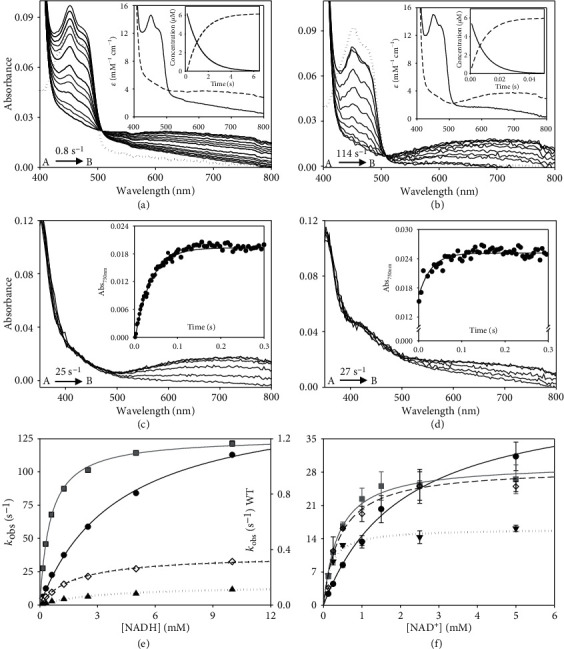
Figure 3.

Kinetic characterization of W196 hAIFΔ1-101 variants. Spectral evolution of the reduction of (a) WT (~10 μM) and (b) W196A variant (~ 10 μM) when mixed with NADH (2 and 5 mM for WT and W196A, respectively). Spectra for the reduction of WTox are shown at 0.15, 1.05, 2.1, 4.2, 6, 10.05, 12.45, 20.1, 30, 40.05, and 50.1 s after mixing and those for W196A at 0.005, 0.05, 0.1, 0.15, 0.2, 0.25, 0.3, 0.45, 0.5, and 0.55 s. Dotted lines correspond to the spectra of oxidized enzymes before mixing with the coenzyme. The corresponding insets show the absorbance spectra for the intermediate species obtained by fitting the spectral evolution to a single step model (A→B) and the evolution of the concentration of each species. Kinetics of CTC formation upon mixing of the hAIF∆1-101phrd forms of (c) WT and (d) its W196A variant with NAD+ (5 mM) under anaerobic conditions. Spectral evolution for CTC formation of WT at 0.001, 0.005, 0.01, 0.015, 0.02, 0.07, 0.1, 0.15, 0.2, 0.33, 0.4, and 0.5 s after mixing and those for W196A at 0.001, 0.002, 0.005, 0.006, 0.007, 0.008, 0.009, 0.01, 0.03, 0.05, 0.07, 0.09, 0.1, 0.3, and 0.5 s. The corresponding insets show the absorption evolution at 750 nm (black circle) and the fits (continuous line) at this wavelength after globally fitting evolution at a single step model (A→B). (e) Dependence of the observed rate constants for flavin reduction for the WT (black circle), W196Y (black triangle), W196L (black diamond), and W196A (grey square) reactions on the NADH concentration. Lines represent the fits of experimental data to equation (3). (f) Dependence of observed rate constants for CTC formation when using WT (black circle), W196Y (black triangle), W196L (black diamond), and W196A (grey square) hAIF∆1-101phrd on the NAD+ concentration. Lines represent the fit of experimental data to equation (4). Assays were performed in a stopped-flow spectrophotometer in 50 mM potassium phosphate, pH 7.4, and at 25°C (n = 3, mean ± SD).
