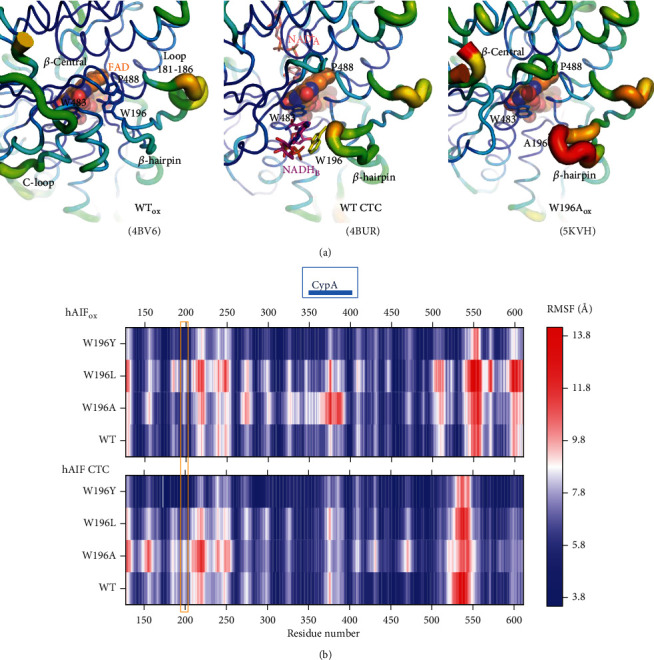
Figure 4.

Impact of mutations on hAIFΔ1-101 flexibility. (a) B-factor putty representation of crystal structures of WT hAIFΔ1-101ox (4BV6), WT CTC (4BUR), and W196A hAIFΔ1-101ox (5KVH) focusing in the environment of the β-hairpin containing residue 196 and the central β-strand. Orange to red colors and a wider tube indicate regions with higher B-factors, whereas shades of blue and a narrower tube indicate regions with lower B-factors. The FAD cofactor is shown as sphere representation with carbons in orange, while, when present, the NAD+A and NADHB are shown as sticks with carbons in salmon and pink, respectively. (b) Heat map representation of the average Cα root mean square fluctuation (RMSF) of five replicates for 10 ns MD simulations of the different W196 variants in both the hAIFΔ1-101ox and CTC states. The region corresponding to the β-hairpin is highlighted with an orange square and that predicted for interaction of CypA is indicated on the top of the panel.
