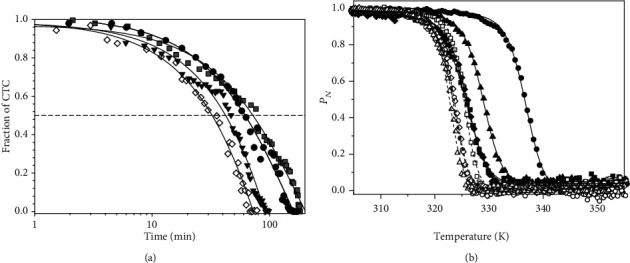
Figure 6.

Effect of W196 replacements on the CTC half-life and the thermal stability of hAIFΔ1-101. (a) Reactivity of the CTC towards O2 in W196 hAIFΔ1-101 variants. hAIF∆1-101rd:NAD+ CTC decay was monitored at 750 nm and 25°C in air saturated 50 mM potassium phosphate at pH 7.4. CTC hAIF∆1-101rd:NAD+ samples were obtained by mixing hAIFΔ1-101ox variants with NADH (0.7-fold the enzyme concentration). The traces for WT (black circle), W196Y (black triangle), W196L (black diamond), and W196A (grey square) hAIFΔ1-101 are shown normalized from 1 to 0 as fraction of CTC remaining along the time. The solid line represents the fit of the traces to a single-exponential decay process to determine CTC half-life. (b) The thermal stability for flavin release (TmFAD) of hAIF∆1-101 variants. Curves for FAD thermal release in oxidized variants (closed symbols) and its CTC state (open symbols), as monitored by increase in FAD fluorescence emission upon protein denaturation. The WT, W196A, W196L, and W196Y hAIF∆1-101 are in black circle, black square, black diamond, and black triangle, respectively. The curves are roughly normalized to the change in fluorescence signal of the FAD bound fraction (PN, from 1 to 0), with their fits to a two-transition unfolding model (continuous and dashed lines for oxidized and reduced states, respectively). Decrease in FAD bound fraction was experimentally followed by the increase in its fluorescence upon release from the holoprotein along a 20 to 85°C temperature ramp. Data were obtained in 50 mM potassium phosphate at pH 7.4 and at a final ionic strength of 150 mM. Protein concentration was ~2 μM. The CTC forms were obtained by premixing hAIF∆1-101ox and NADH at a 1 : 100 ratio.
