
Figure 2.
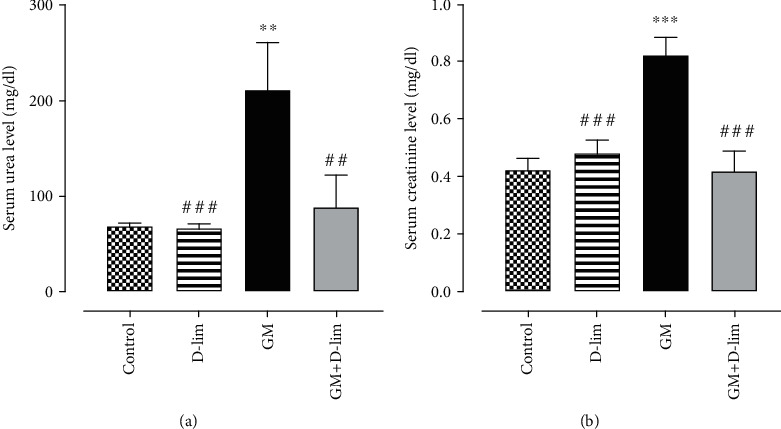
The effects of D-lim on the serum levels of renal function parameters including urea (a) and creatinine (b) in rats intoxicated with GM. Bars indicate 8. Data with normal distribution (creatinine) were compared between groups using one-way ANOVA followed by a post hoc LSD test. Nonnormal distribution data (urea) were compared between groups using the Mann–Whitney U test. ∗∗P ≤ 0.01 and ∗∗∗P ≤ 0.001, against the control group. ##P ≤ 0.01 and ###P ≤ 0.001, against the GM group.