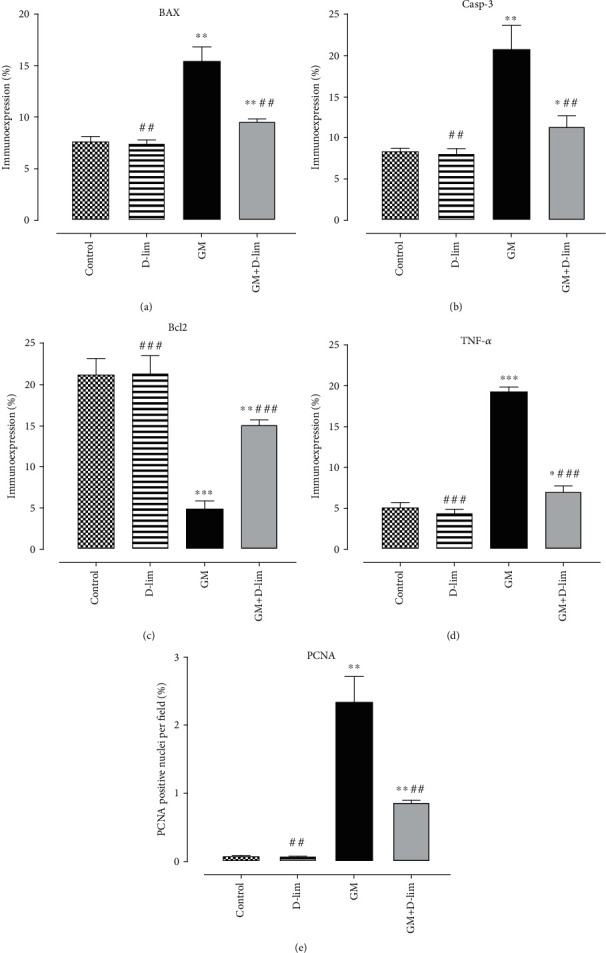
Figure 7.

The effects of D-lim on immunoexpression of Bax (a), Casp-3 (b), Bcl2 (c), TNF-α (d), and PCNA (e) in the kidney of rats intoxicated with GM. Data with normal distribution (Bcl2 and TNF-α) were compared between groups using one-way ANOVA followed by a post hoc LSD test. Nonnormal distribution data (Bax, Casp-3, and PCNA) were compared between groups using the Mann–Whitney U test. ∗P < 0.05, ∗∗P ≤ 0.01, and ∗∗∗P ≤ 0.001, against the control group. ##P ≤ 0.01 and ###P ≤ 0.001, against the GM group.
