
Figure 6.
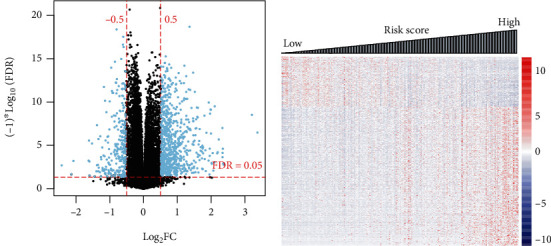
Identification of DEGs between the high-risk and low-risk groups. (a) Volcano plot of effect size (log2FC) − log10(FDR) of the DEGs. (b) Risk score distribution of these DEGs expression profiles.
Official websites use .gov
A
.gov website belongs to an official
government organization in the United States.
Secure .gov websites use HTTPS
A lock (
) or https:// means you've safely
connected to the .gov website. Share sensitive
information only on official, secure websites.
Identification of DEGs between the high-risk and low-risk groups. (a) Volcano plot of effect size (log2FC) − log10(FDR) of the DEGs. (b) Risk score distribution of these DEGs expression profiles.