
Figure 7.
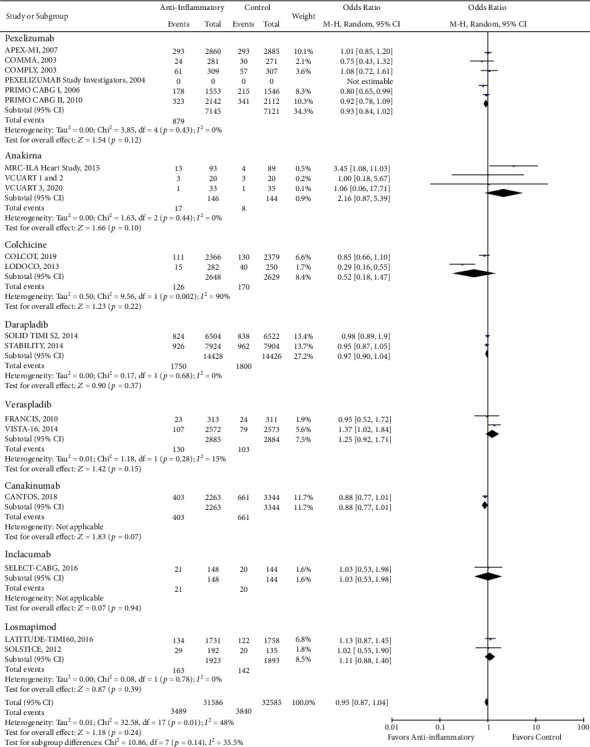
Forest plot of MACCE. There was no significant difference between anti-inflammatory therapy and standard therapy alone regarding MACCE (OR 0.95, CI 0.87-1.04; P = 0.24).
Official websites use .gov
A
.gov website belongs to an official
government organization in the United States.
Secure .gov websites use HTTPS
A lock (
) or https:// means you've safely
connected to the .gov website. Share sensitive
information only on official, secure websites.
Forest plot of MACCE. There was no significant difference between anti-inflammatory therapy and standard therapy alone regarding MACCE (OR 0.95, CI 0.87-1.04; P = 0.24).