
Figure 1.
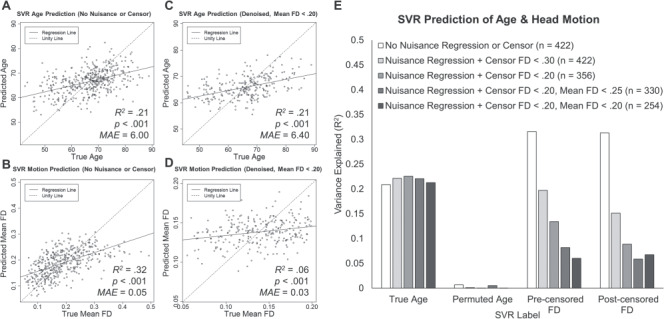
(A–D) SVR prediction results for age (A and C) and head motion (B and D). Label values predicted by the model are plotted as a function of the true value. SVR prediction results are displayed for resting-state BOLD SD values from data without nuisance regression or framewise censoring (A and B) and from the final denoised data (C and D). (E) SVR model prediction performance for true age labels, randomly permuted age, precensored FD, and postcensored FD across a range of artifact rejection procedures. Model prediction accuracy is plotted as variance explained, R2, for each model.