
Figure 5.
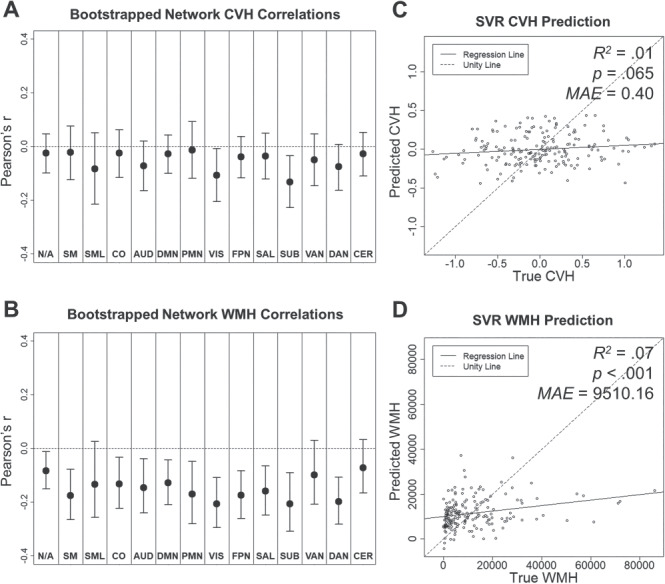
Relationships between resting-state BOLD SD, CVH composite (A and C), and WMH (B and D). (A and B) Network average Pearson correlations (bootstrapped mean and 95% confidence interval). (C and D) CVH and WMH measures predicted by SVR model as a function of true score.