
Figure 6.
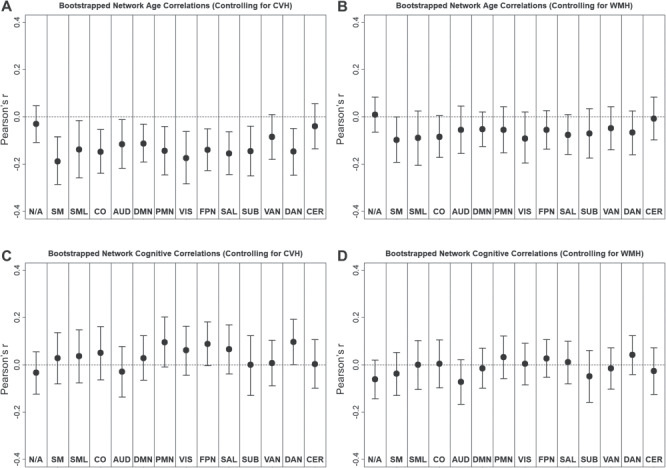
Network average Pearson correlations (bootstrapped mean and 95% confidence interval) between resting-state BOLD SD and age (A and B) or cognitive composite (C and D). Relationships are shown for residuals of resting-state BOLD SD after controlling for either the CVH composite (A and C) or WMHs (B and D).