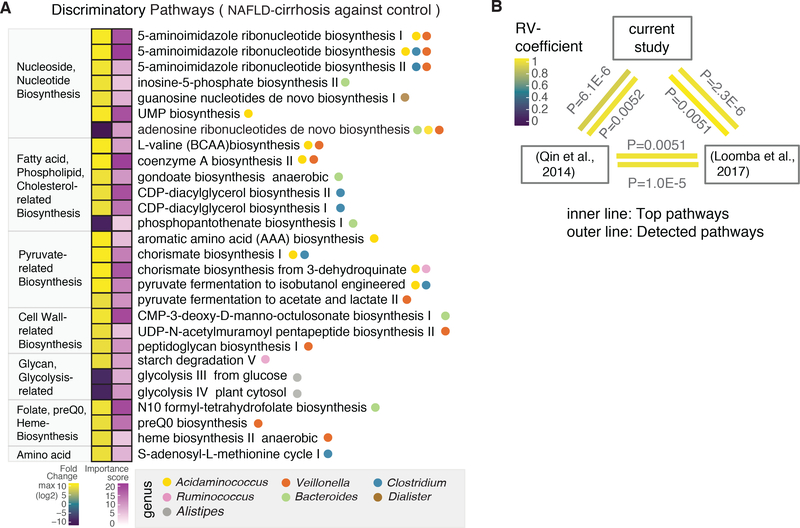
Figure 2. Microbial functional pathways altered in cirrhosis.
(A) Microbial pathways associated with NAFLD-cirrhosis and non-NAFLD control groups were identified using the HUMAnN2 tool, which includes an analysis of microbial gene-families. Discriminatory pathways were selected using feature selection by Random Forest (RF) and differential abundance analyses through the computation of mean decrease in Gini and fold-change. Left column denotes fold-change, based on log2 scale. In the fold-change color scale, yellow represents microbial pathways that were increased in the NAFLD-cirrhosis group compared to the non-NAFLD control group. Purple represents pathways that were decreased in the NAFLD-cirrhosis group compared to the non-NAFLD control group. Right column denotes importance of the pathway in the RF model, based on Mean Decrease in Gini score. In the associated color scale, pathway importance is represented by a gradient going from light purple to dark purple. Circles denote specific genera that significantly associate with discriminatory functional pathways.
(B) A multivariate RV-coefficient analysis was performed with HUMAnN2 pathway outcomes from three different datasets including the current study, Chinese cohort and our previous study. The statistic tool, the FactorMineR package, was utilized to calculate RV-coefficient scores among cohorts. The color of the inner line represents the significant of top discriminatory pathways shown in Figure 2A. Outer line represents the significance of pattern alteration from all detected pathways.

