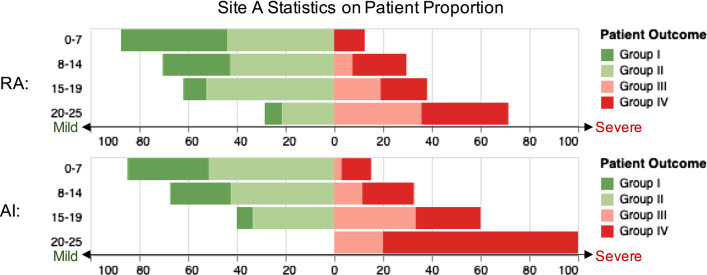
Fig. 5.
For each severity score bucket shown in vertical, horizontal stacked bars present the proportion of patient number of one severity group to patient number of all severity groups of Site A in the bucket. Widths of the bars represent such proportion (mild patient: green for group I and light green for group II; severe patient: light red for group III and red for group IV)

