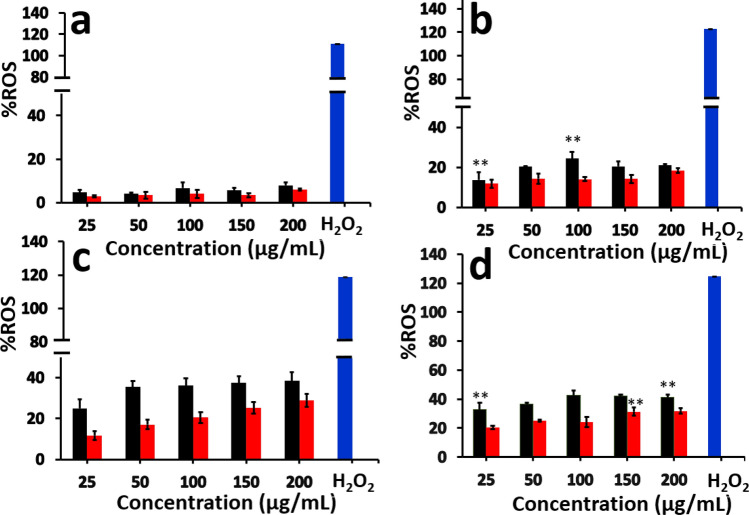
Figure 9.
Concentration of ROS produced in BHK-21 cells after (a) 24 h, (b) 48 h, (c) 96 h and (d) 120 h of incubation with PVC (■) and PMMA ( ) NPs at different concentrations. The data for 72 h incubation were given in the supporting information, Figure S9. The results are given as % of the ROS production with respect to the control (untreated cells) and are the mean ± SEM of three experiments. Statistical analysis was done by one-way ANOVA (*p < 0.05, **p < 0.01, ***p < 0.001, ****p < 0.0001) compared to control cells with no particles added.

