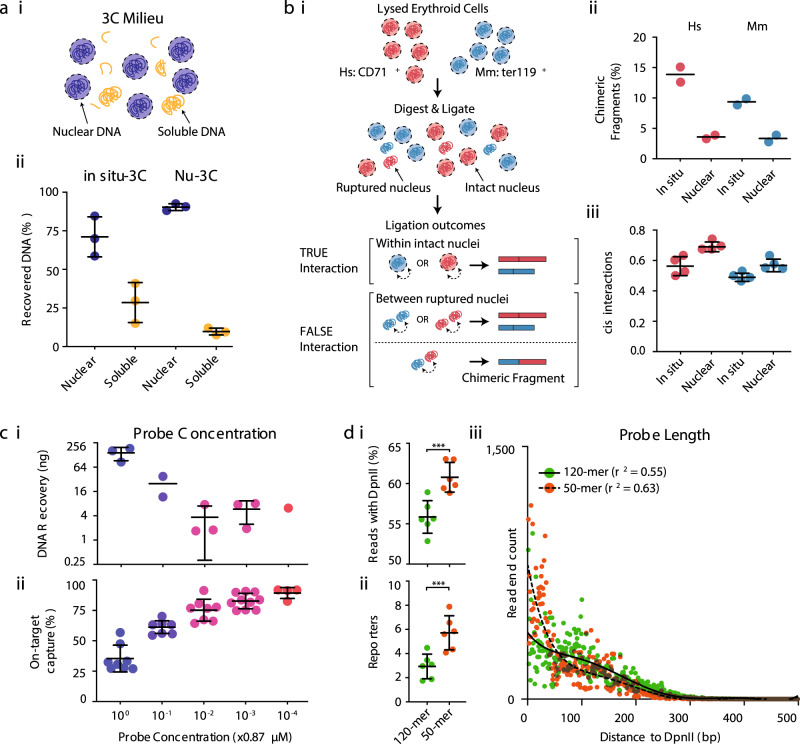
Fig. 1. Nuclear-Titrated Capture-C minimizes noise while maximizing on-target enrichment.
a (i) During digestion and ligation nuclei can shear leading to free soluble chromatin. Intact nuclei can be separated from freed material by centrifugation. (ii) Percent of total DNA recovered in the two fractions using standard in situ-3C and a modified Nuclear 3C (Nu-3C) approach. n = 3 independent experiments. Bars show mean and one standard deviation. b (i) Lysed erythroid cells from human and mouse were mixed in a 1:1 ratio prior to generation of 3C libraries. Ligation occurring between ruptured nuclei can be detected as inter-species chimeric DNA fragments after filtering for sequences that map to both genomes. (ii) Level of inter-species chimeras and (iii) number of reported cis interactions when using standard in situ-3C or modified Nuclear 3C (Nu-3C) at the Hba-1/2 and Slc25a37 promoters (n = 2 viewpoints from two independent libraries). Bars show mean and one standard deviation. c Total yield of DNA recovered following single capture (n ≥ 1 independent capture experiments where each dot is an independent capture) (i) and total number of mapped reads containing on-target capture sequence following double capture (n ≥ 4 libraries from multiple independent captures, where dots indicate libraries) (ii) when 11 probe pairs were used at final concentrations ranging from 0.87 µM to 87 pM. For DNA recovery each dot is a multiplex capture with between 3 and 6 libraries. Bars show mean and one standard deviation. d Percent of reads with a DpnII site (i), number of PCR duplicate filtered reporters per 100 mapped reads containing a reporter (ii) following capture of six 3C libraries with 120-mer and 50-mer oligonucleotides. n = 6 independent experiments. ***p = 0.0001 using a two-sided Mann–Whitney U-test. Bars show mean and one standard deviation. (iii) Counts of read-ends generated by sonication breakpoints as the distance to the nearest end of the Slc25a37 viewpoint. Each dot is average depth normalized count at each position for 100,000 mapped reads (n = 12). Lines of best fit were generated as a sixth order polynomial with r2 shown in the legend. Source data are available in the Source Data file.

