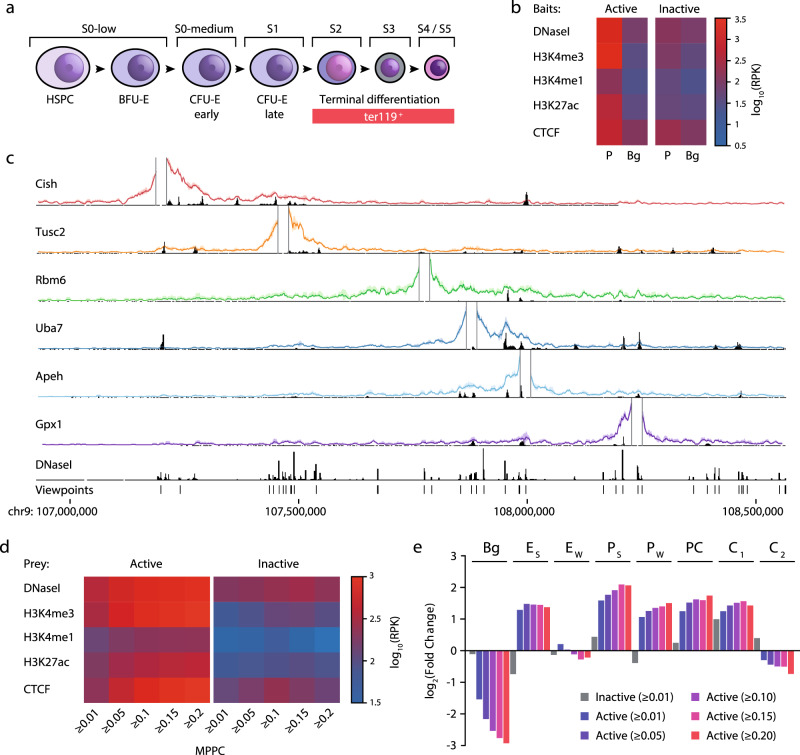
Fig. 3. Genome-wide high-resolution 3C in mouse erythroid cells.
a Stages (S) of commited murine erythropoiesis with FACS-sorted populations including haematopoietic stem and progenitor cells (HSPC), erythroid blast forming units (BFU-E), and colony-forming units (CFU-E). b Average sequence coverage signature of promoter (P) containing fragments (±1 kb) classified as active (n = 7014) or inactive (n = 181) compared to an equivalent number of background regions (Bg). Chromatin marks from mouse erythroid cells show open chromatin (DNaseI), promoters (H3K4me3), active transcription (H3K27ac), enhancers (H3K4me1), and boundaries (CTCF). Background (Bg) signal was calculated by generating random peaks of the same number and size using BEDtools shuffle. RPK reads per kilobase. c Windowed mean 3C interactions (n = 3 independent 3C libraries) over 1.5 Mb (mm9: chr9:106926158-108566246) for six NuTi Capture-C viewpoints with peaky Marginal Posterior Probability of Contact (MPPC) scores (black peaks) and open chromatin (DNaseI). d Average chromatin signal for interacting fragments (prey) of increasing MPPC identified by capturing either active or inactive promoters. e Enrichment of GenoSTAN annotations for interacting fragments with increasing MPPC. Bg: Background, ES: Enhancer (Strong H3K27ac), EW: Enhancer (Weak H3K27ac), PS: Promoter (Strong H3K27ac), PW: Promoter (Weak H3K27ac), PC: Promoter/CTCF, C1: CTCF near Promoter/Enhancer, C2: CTCF. Source data are available in the Source Data file.

