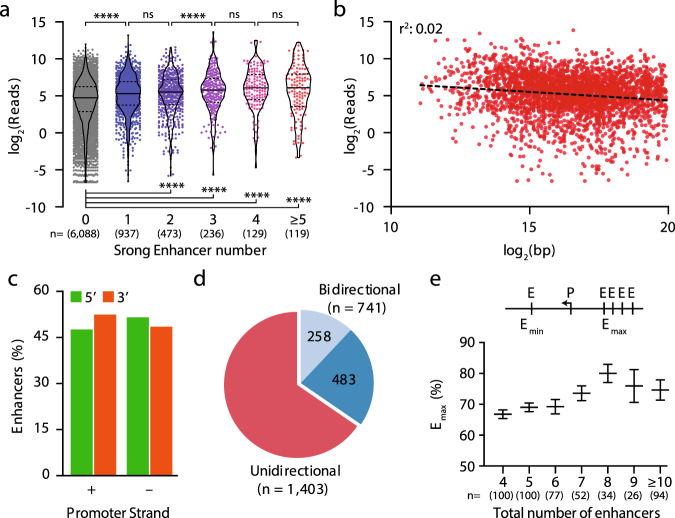
Fig. 5. Enhancers show directional organization.
a S3 nascent expression (4sU-seq) of genes interacting with elements identified as being strong enhancers by GenoSTAN. ****p < 0.0001, nonsignificant (ns), one-way ANOVA with Sidak’s multiple comparison tests. b S3 nascent expression of genes plotted against closest enhancer element. Line shows linear regression, r2 values is for Pearson correlation (r = −0.146, p < 0.0001). c Distribution of enhancer location (5’ or 3’) based on promoter strand (+ or –). d Number of promoters with multiple enhancers where the enhancers are all upstream or downstream (unidirectional: co-location) or a mixture of upstream and downstream (bidirectional). Bidirectional promoters with two or three enhancers (n = 258) are distinguished from those with four or more enhancers (n = 483) by light and dark blue, respectively. e Percent of enhancers on the side with the most enhancers (Emax) at bidirectionally interacting promoters. Bars show standard error of the mean. n = number of promoters. Source data are available in the Source Data file.

