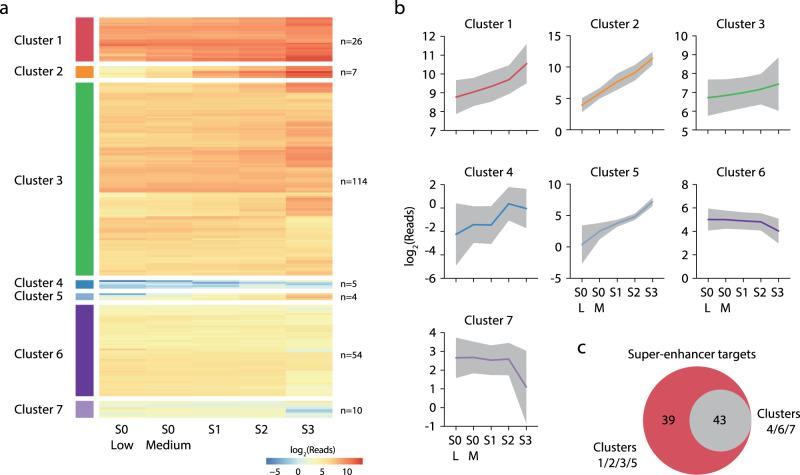
Fig. 8. Temporal expression profiles of super-enhancer-interacting genes.
a Heirachical clustering of nascent 4sU RNA-seq in haematopoietic stem and progenitor and burst-forming unit-erythroid cells (S0-Low), early and late colony-forming unit-erythroid cells (S0-medium and S1, respectively), and maturing terminal differentiating cells (S2, S3). b Mean expression of genes in each cluster, gray shading denotes one standard deviation. c Number of super-enhancers that interact with increasing expression clusters (1,2,3,5) or low expression and stable/decreasing clusters (4,6,7). Source data are available in the Source Data file.

