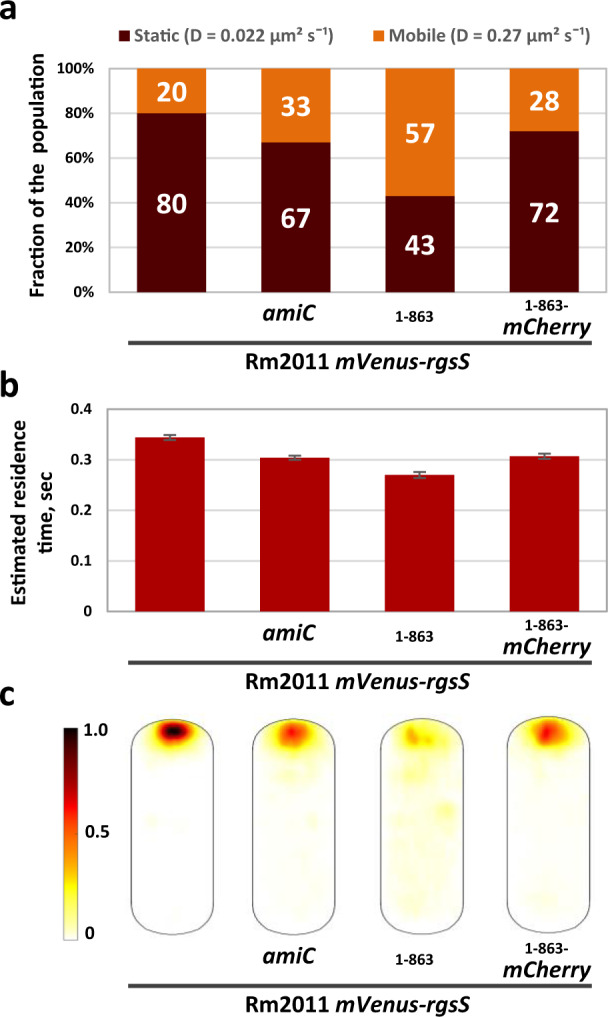
Fig. 5. AmiC and SPORRgsS facilitate stable positioning of mVenus-RgsS molecules at the cell pole.

Single-molecule tracking of mVenus-RgsS, mVenus-RgsS1–863, and mVenus- RgsS1–863-mCherry molecules in cells from exponential phase TY cultures. Single molecule tracks were collected from cells, originating from three independent biological replicates. Numbers of single molecule tracks analyzed: Rm2011 mVenus-rgsS, n = 7556; Rm2011 mVenus-rgsS amiC, n = 5439; Rm2011 mVenus-rgsS1-863, n = 2296; Rm2011 mVenus-rgsS1-863-mCherry, n = 5469. a Relative fraction size of molecule populations with two different normalized diffusion constants, determined by Gaussian-mixture model (GMM) fit. Statistics analysis and numerical data are presented in Supplementary Table 9. b Estimated average residence times (time a molecule stays in a radius of 128.7 nm for more than nine 20 ms intervals), calculated from single molecule tracking data. Data presented as mean values of residence times calculated for each trajectory. Error bars indicate the standard deviation of the mean. Numerical data is presented in Supplementary Table 9. c Probability heatmaps of mVenus-RgsS, mVenus-RgsS1–863, and mVenus-RgsS1–863-mCherry molecules trajectory distribution in a normalized cell. The color code on the left indicates the probability of the molecules to be detected in the given cell area.
