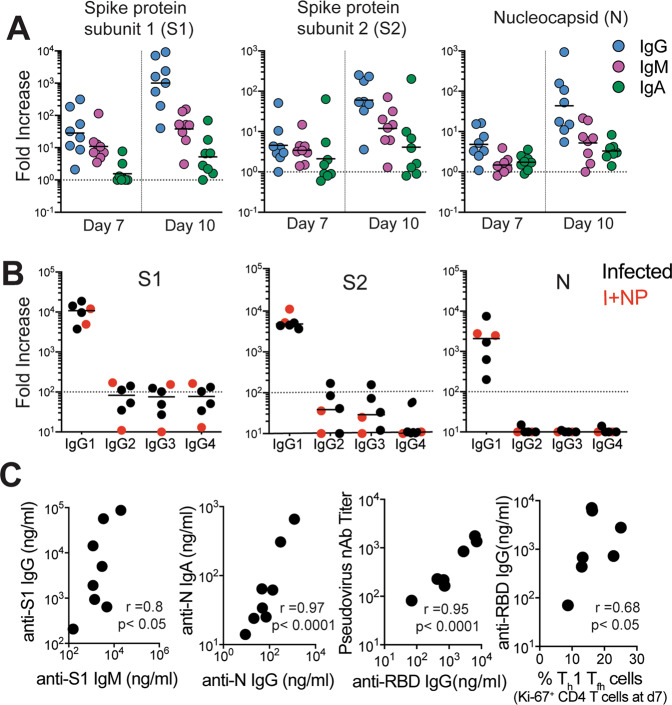
Fig. 10. IgG1 subclass and neutralizing antibodies induced following SARS-CoV-2 infection.
A Fold increase in antibody responses in animals was determined by dividing post-infection concentrations by those measured on day 0 in each animal. Data shown are n = 8 animals for all time points. Horizontal line indicates median B Fold increase in IgG1, IgG2, IgG3, and IgG4 antibodies against S1, S2, and N show dominance of IgG1 subclass antibodies. Data shown are for n = 6 animals not given CP. C Correlations between day 10 levels of S1-specific IgG and IgM, N-specific IgA and IgG, and pseudovirus neutralizing antibody titers and anti-receptor binding domain (RBD) IgG antibodies measured by ELISA. Unique symbols identify animals in each of the experimental groups (two-tailed Pearson test p values shown; correlation for anti-RBD IgG and Th1 Tfh cells shows one-tailed Spearman test p value).

