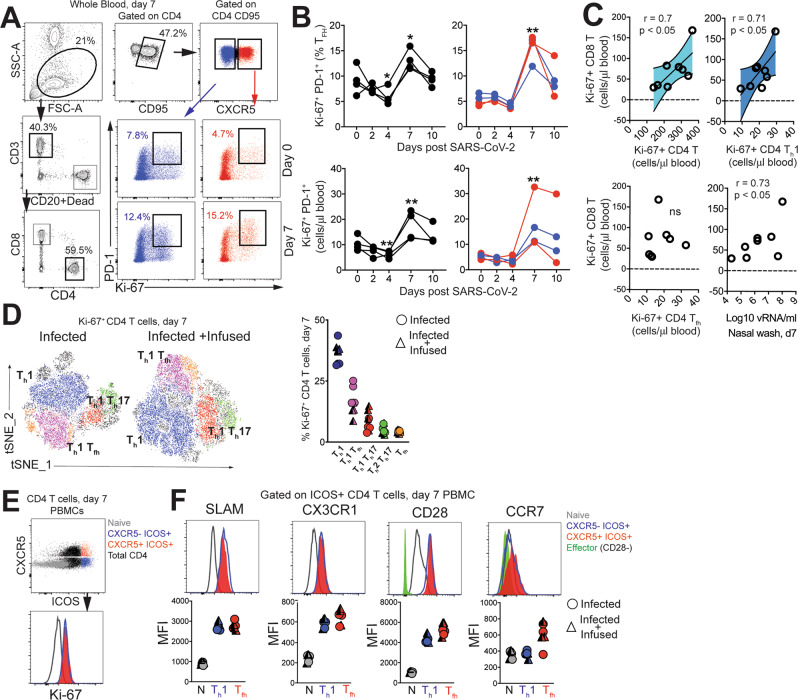
Fig. 3. SARS-CoV-2 infection increases the number CD4 T follicular helper cells in peripheral blood.
A Representative gating strategy to capture CD4 T cells expressing Ki-67 and programmed death-1 (PD-1) in whole blood. Fluorochromes used were CD3-A700, CD20/Dead-APC-Cy7, CD8-BUV 805, CD4-BV650, CD95-BUV737, CXCR5-PE, PD-1-Pe Cy7, Ki-67-A488, CXCR3-BV786, CCR6-PECF594, CCR4-BV605, SLAM-A488, CX3CR1-PECF594, CD28-Pe-Cy7, CCR7-BV711, ICOS-BV786. B Kinetics show frequency and absolute counts of Ki-67+ PD-1+ CD4 T follicular helper cells (Tfh) cells (% of Tfh cells; *p = 0.01 at d4 and d7 relative to d0 for infected and **p = 0.002 at d7 relative to d0 for infused using a one-tailed paired t test, absolute Tfh cell counts; **p = 0.003 at d4 and **p = 0.0086 at d7 relative to d0 for infected and **p = 0.003 at d7 relative to d0 for infused using a one-tailed paired t test. Data are from a real-time longitudinal staining of whole blood performed a single time) C correlation plots of Ki-67+CD8 T cells against Ki-67+ CD4 subsets, and viral(v)RNA (all day 7) (two-tailed Pearson test p values shown. 95% confidence bands of the best fit line are shown) D t-distributed stochastic neighbor embedding (tSNE) plot based on flow cytometry data of CD4 Ki-67+ events at Day 7 from infected (16,197 events) and infected + infused animals (22,406 events); dot plot shows frequency of Ki-67+ CD4 T-cell subsets. (E–F) Histograms and median fluorescence intensity (MFI) dot plots illustrate relative expression of signaling lymphocyte activation molecule (SLAM), CX3C chemokine receptor 1 (CX3CR1), CD28, and C-C chemokine receptor type 7(CCR7) within four different populations identified at Day 7 in peripheral blood mononuclear cells (PBMCs, n = 7). Unique symbols identify animals in each of the experimental groups.

