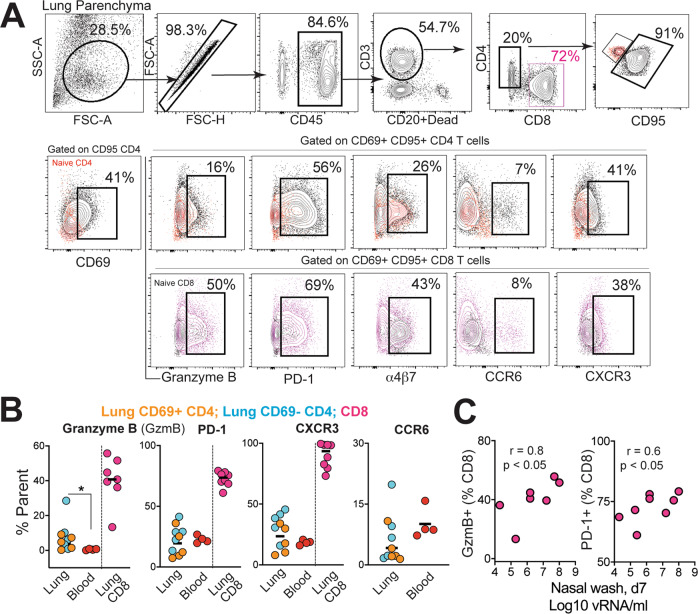
Fig. 6. Induction of Th1 CD4 effectors in the lungs during SARS-CoV-2 infection.
A Gating strategy for identifying CD95+ CD69+ CD4 and CD8 cells expressing granzyme B, PD-1, α4β7, CCR6, and CXCR3. Fluorochromes used were CD45-A488, CD3-A700, CD20/Dead-APC-Cy7, CD8-BUV 805, CD4-BV650, CD95-BUV737, CD69-BV711, Granzyme B- BV421, PD-1-Pe Cy7, a4b7-PE, CD25-APC, CCR6-PECF594, CXCR3-BV786. B Percentage of CD4 and CD8 T cells expressing granzyme B, PD-1, CXCR3, and CCR6 in lung and blood (*p = 0.02 using a two-tailed Mann–Whitney U test). C Correlation plot of vRNA from nasal washes and either granzyme B (GzmB) or PD-1 in CD8 T cells (one-tailed Pearson test p values shown).

