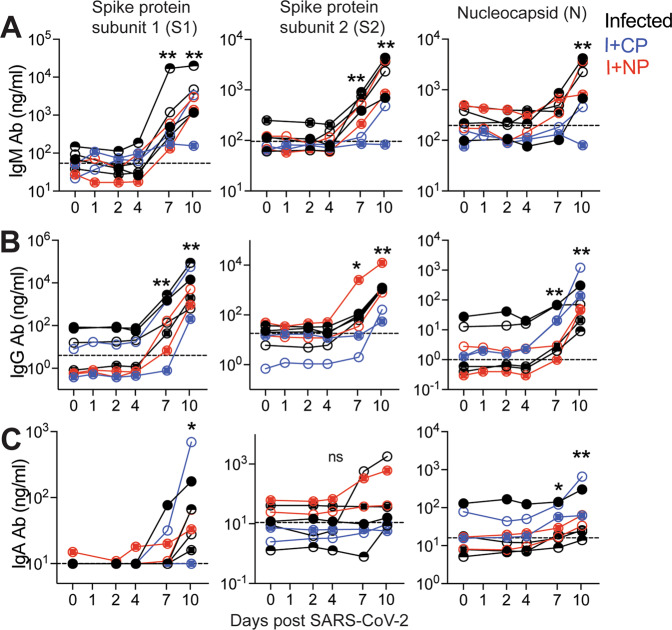
Fig. 9. Humoral responses to SARS-CoV-2 are dominated by IgG antibodies.
Concentrations of A IgM, B IgG, and C IgA antibodies (Ab) specific for S1, S2, and N proteins measured by BAMA or ELISA in serum. The dashed line represents the median pre-infection (day 0) concentration for all animals. Unique symbols identify animals in each of the experimental groups. (**p = 0.007, *p = 0.015 at indicated time points relative to d0 using a Wilcoxon matched-pairs signed-rank two-tailed t test).

