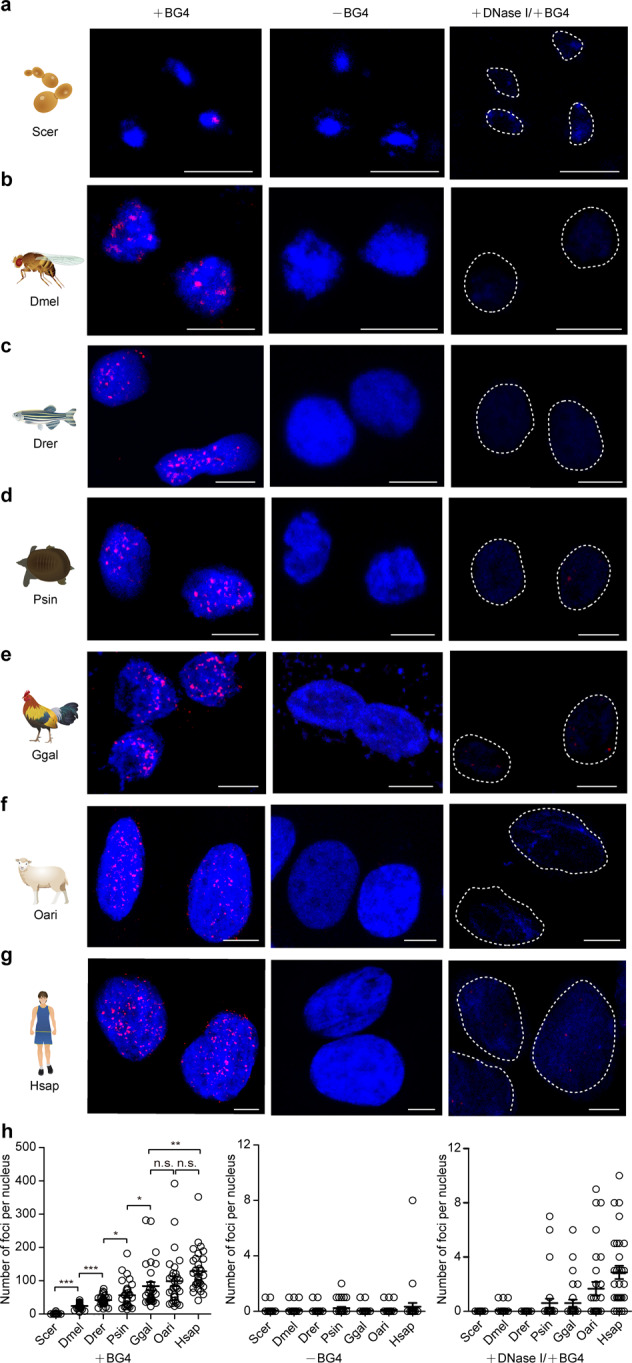
Fig. 3. Detection of the G4 structures in the representative species by immunofluorescence staining.

a–g Immunofluorescence staining signals showing the G4 structures in Saccharomyces cerevisiae (Scer), Drosophila melanogaster (Dmel), Danio rerio (Drer), Pelodiscus sinensis (Psin), Gallus gallus (Ggal), Ovis aries (Oari), and Homo sapiens (Hsap). h Quantification statistics of the number of G4 structures per nucleus in Scer, Dmel, Drer, Psin, Ggal, Oari, and Hsap cells. Signal spots in 30 nuclei from three replicates (ten nuclei for each replicate) were counted for each species. Data are the mean ± SEM (n = 30), statistical significances were determined by Student’s t test, *p < 0.05, **p < 0.01, and ***p < 0.001. The scale bars equal 5 μm.
