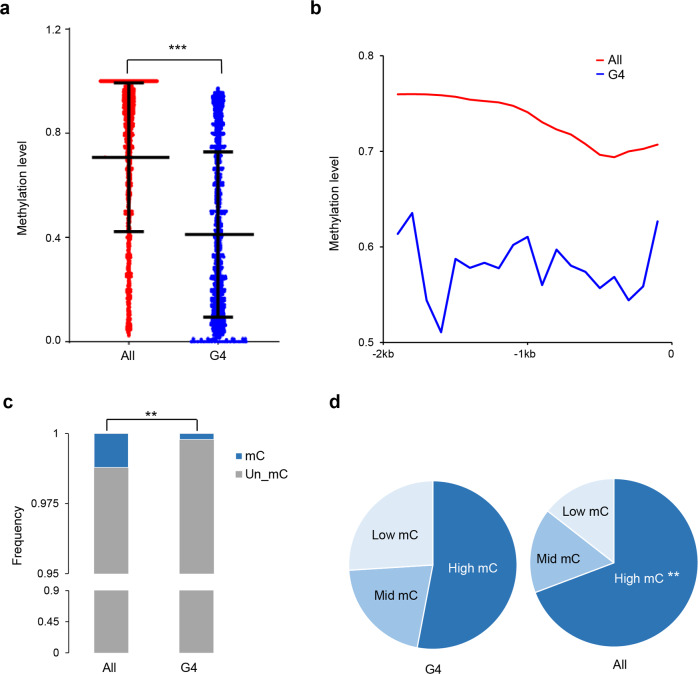
Fig. 6. Relationship between the DNA G4 motifs and CpG methylation level in the upstream 2 kb regulatory regions of genes in pig and silkworm.
a The methylation levels of the cytosines at upstream 2 kb region of all genes (All) and those genes bearing the (G/C)3L1–7 motifs in their upstream 2 kb region (G4) in the pig. Bars from the top to the bottom indicate the value of the three quarters, the median and a quarter respectively. ***p < 0.001 by Wilcoxon test. n = 34,333 cytosine sites for the former and 148,769 cytosine sites for the latter. b Plot of the methylation level distribution in the upstream 2 kb regulatory region of genes in the pig. Methylation levels were calculated in 200 bp sliding windows with a 100 bp step. Proportion of unmethylated and methylated cytosines (c) and the methylated cytosines (mCs) with different methylation levels (d) in the upstream 2 kb region of all genes (All) and those genes bearing the (G/C)3L1–7 motifs in their upstream 2 kb region (G4) in the silkworm. High mC hypermethylated cytosines (methylation level > 0.6), mid mC moderate methylated cytosines (0.3 < methylation level < 0.6), low mC hypomethylated cytosines (0 < methylation level < 0.3). **p < 0.01 by chi-square’s test (data subjected to this test were shown in Supplementary Data 1). All: the results of all genes; and G4: the results of the genes bearing the (G/C)3L1–7 motifs in their upstream 2 kb region.

