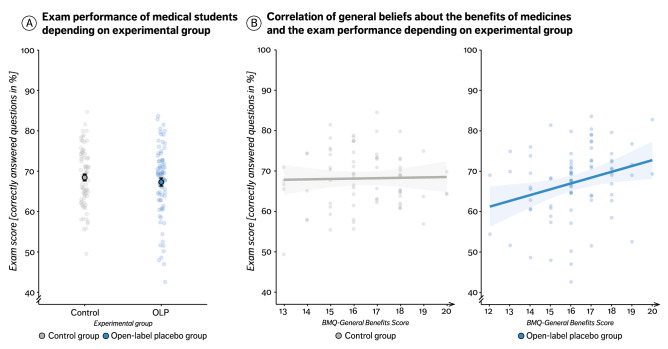
Figure 3.
A and B. Impact of open-label placebos on the test performance. (A) Exam scores (percentage of correct answered questions out of all questions answered) separately for both groups. Displayed are mean values (single, black surrounded dots) ± standard error of the mean, and single subject scores (faded blue or grey dots). (B) Correlation between the BMQ benefit score and the exam score in the OLP group (r = 0.28, t(77) = 2.58, p = .011, right) and control group (r = − 0.03, t(73) = − 0.30, p = .766, left). Displayed are single subject scores (faded blue or grey dots) and regression lines.

