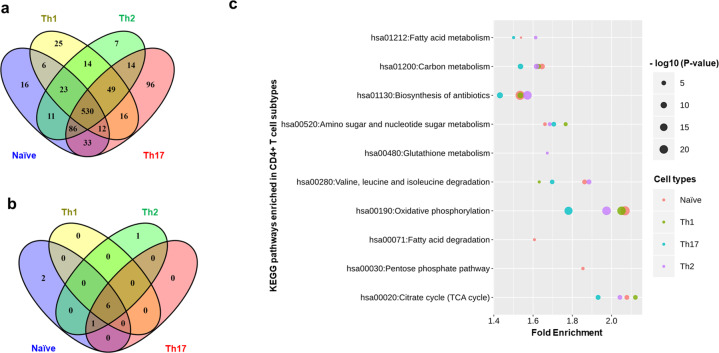
Fig. 2. Construction of metabolic models in CD4+ T cells.
a Expressed metabolic genes identified using integrated transcriptomics and proteomics data of CD4+ T-cell subtypes. b KEGG pathway enrichment analysis of expressed genes in each cell type using all 1892 metabolic genes as a background. c Fold enrichment and P-values (larger sizes correspond to lower P-values) of KEGG pathways enriched across CD4+ T-cell subtypes. A pathway was considered significantly enriched with P-value < 0.05 and false discovery rate (FDR) <5%.

