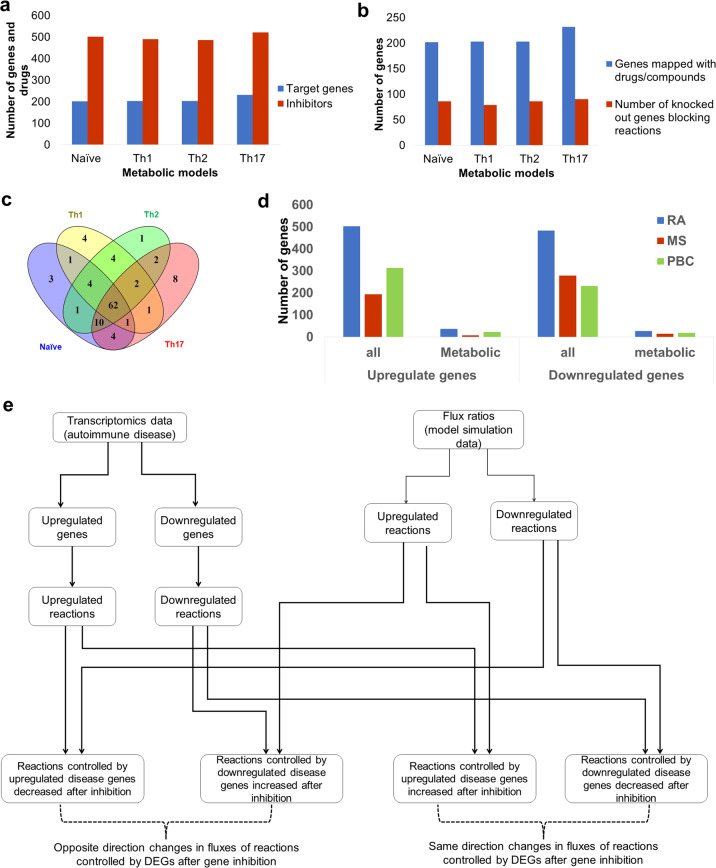
Fig. 5. Identification of potential drug targets for RA, MS, and PBC.
a Distribution of metabolic drug target genes, and inhibitory drugs or compounds in each model. b Number of metabolic genes in the models mapped with inhibitory drugs (blue bars) and number of genes among drugs mapped genes that can block at least one reaction upon inhibition (red bars). c Comparison of metabolic drug targets that affect reactions upon deletion in CD4+ T-cell models. d Number of all differentially expressed genes (DEGs) and metabolic DEGs in three diseases rheumatoid arthritis (RA), multiple sclerosis (MS), and primary biliary cholangitis (PBC) (Padj < 0.05). The DEGs were analyzed using three transcriptomics datasets (one dataset per disease). The data were obtained from peripheral CD4+ T cells of groups of patients and healthy individuals. e Schematic representation of the integration of disease-associated differentially expressed genes and affected reaction on each drug target gene perturbation. For each drug target deletion, we investigated how many of fluxes regulated by upregulated genes are decreased and fluxes regulated by downregulated genes are increased. We used these numbers to calculate PES (perturbation effect score, see Materials and methods).

