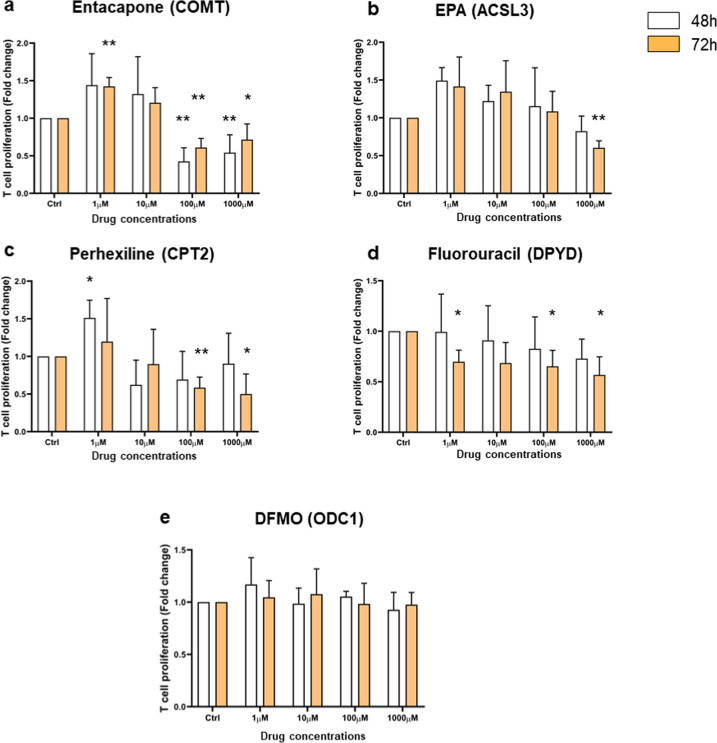
Fig. 7. Analysis of CD4+ T-cell proliferation response upon drug treatment by MTT assay.
CD4+ T cells were exposed to various concentrations of drugs (1, 10, 100, and 1000 μM) for 48 h (white bars) and 72 h (orange bars). Drugs’ names (Entacapone, EPA, Perhexiline, Fluorouracil, and DFMO) were indicated on the top of each graph bar with their corresponding targeted gene in parentheses. Cell proliferation is expressed as fold change ± SEM relative to untreated control cells and is representative of four independent experiments. Statistic significance was only shown for effective concentration and was evaluated using a paired t-test, one-tailed (*p < 0.05, **p < 0.005).

