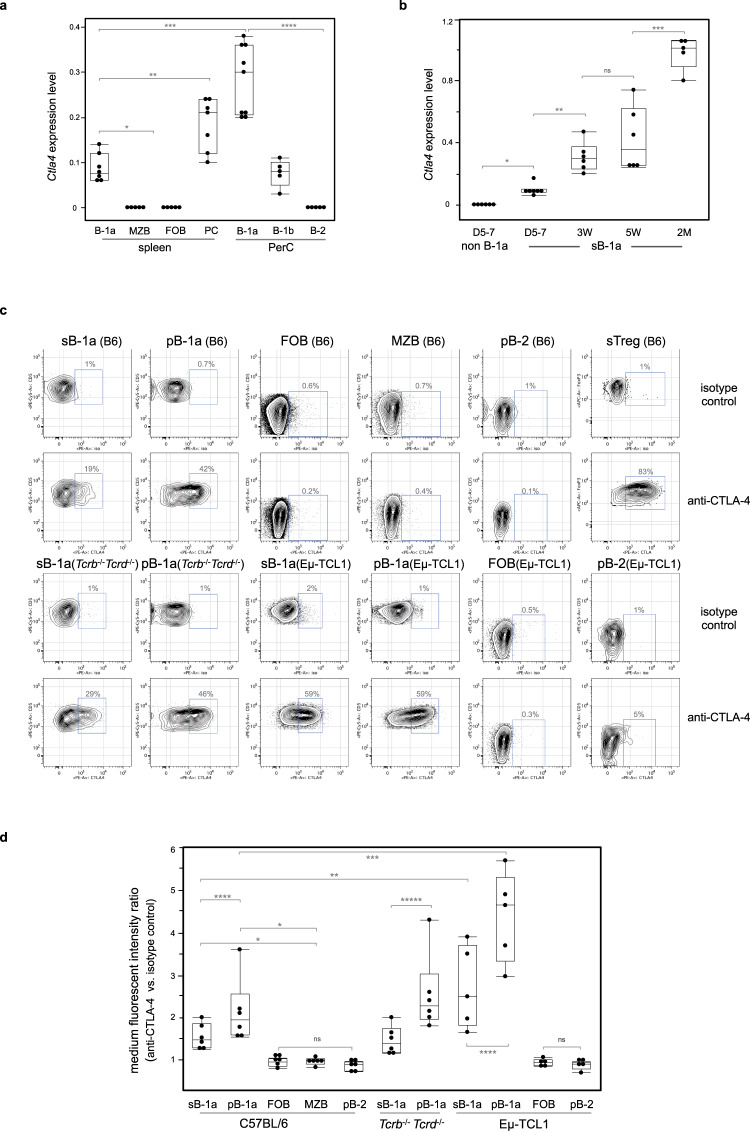
Fig. 1. CTLA-4 is selectively expressed by B-1 cells within the resting B-cell compartment.
a Ctla4 expression by mature B-cell subsets in adult C57BL/6J mice (2–3 months old) was measured by qRT-PCR. B-cell subsets were phenotypically defined as: B-1a, CD19+ IgMhi IgDlo/− CD21lo/− CD43+ CD5+; B-1b, CD19+ IgMhi IgDlo/− CD43+ CD5neg; MZB, CD19+ IgMhi IgDlo/− CD21hi CD43neg CD5neg; FOB and peritoneal B-2, CD19+ IgMlo IgDhi CD43neg CD5neg; PCs, CD19+ IgDneg CD138+ CD267+. Ctla4 expression levels are shown as the data relative to the Ctla4 level expressed by splenic CD3+ CD4+ CD25+ Treg cells (>90% Foxp3+) using comparative CT method 2–∆∆CT. Each dot represents data for an individual mouse, n = 5–9 mice per subset. *p < 0.003, **p < 0.007, ***p < 0.001, ****p < 0.002. b Ctla4 expression by splenic B-1a (sB-1a) and non B-1a cells in neonatal, young or adult mice was measured by qRT-PCR. D, day, W, week, M, month. FACS gating is shown in Supplementary Fig. 1B. Ctla4 expression levels are shown as the data relative to the Ctla4 level expressed by adult sB-1a. n = 5–7 mice per group, *p < 0.001, **p < 0.003, ***p < 0.006, ns, not significant (p < 0.5). c CTLA-4 expression by sB-1a, peritoneal B-1a (pB-1a), FOB, MZB, peritoneal B-2 (pB-2), and splenic Treg (sTeg) cells from indicated mice were measured by intracellular CTLA-4 FACS analysis. FACS gating is shown in Supplementary Fig. 1C. y axis shows surface CD5 expression for B-cell subsets and intracellular Foxp3 expression for sTreg cells, x axis shows data for cells stained with phycoerythrin (PE)-conjugated anti-CTLA-4 or isotype control antibodies. d Data summarizing independent FACS analyses (n = 6) is shown, each dot represents data for an individual mouse. y axis shows ratio of medium fluorescent intensity (MFI) values of the indicated B-cell subsets stained with PE-conjugated anti-CTLA-4 vs. isotype control antibody. *p < 0.0001, **p < 0.03, ***p < 0.01, ****p < 0.05, *****p < 0.007, ns, not significant (p < 0.6). Box plots in a, b, d: box draws 75% (upper), 50% (center line), and 25% (down) quartile, the maxima and minima outliers are shown as top and bottom line, respectively. Statistical significance was tested using nonparametric Wilcoxon one-way test.

