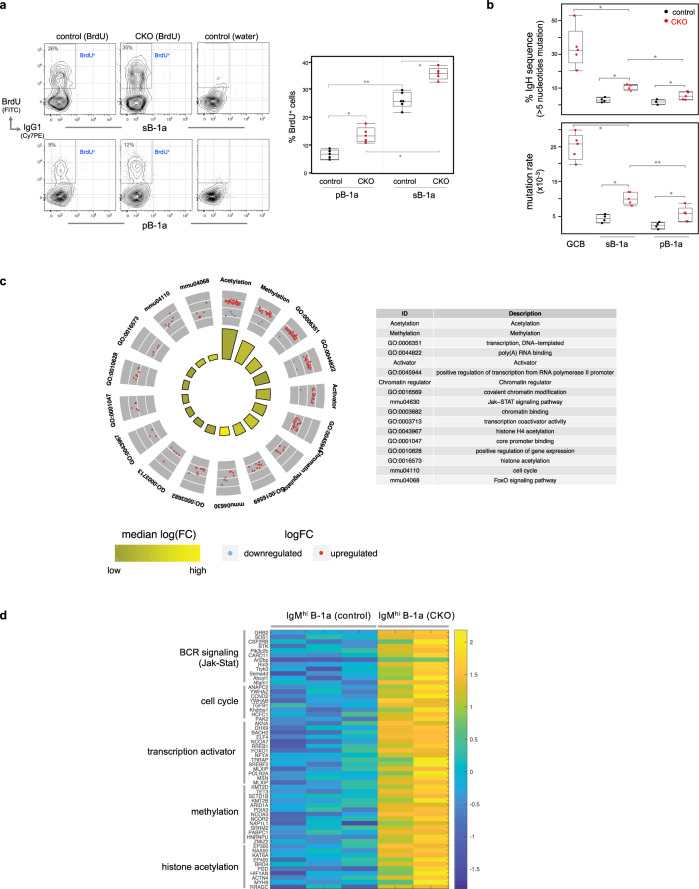
Fig. 2. B-1a cells in CKO mice show increased self-replenishment and upregulate activation gene programs.
a Control or CKO mice were fed with BrdU-containing water for 6 days and BrdU incorporation (BrdU+) by splenic and peritoneal B-1a cells in these mice was measured by FACS analysis. B-1a cells were gated as CD19+ IgMhi IgDlo/neg CD21lo/neg CD43+ CD5+. Data summarizing the percentages of BrdU+ cells in sB-1a or pB-1a cells for five independent experiments is shown. Each dot represents data for an individual mouse. *p < 0.01, **p < 0.006, nonparametric Wilcoxon one-way test. b sB-1a, pB-1a, and GC B (CD19+ CD95+ CD38neg) cells in control or CKO mice were sorted and then sequenced to obtain their IgH transcripts. The percentages of IgH transcripts containing >5 nucleotide changes and the mutation rate for each population are shown, n = 4–5 biologically independent samples per subset, each sample was from an individual mouse, *p < 0.01, **p < 0.02, nonparametric Wilcoxon one-way test. c Circular visualization graph shows the selected GO terms for differentially expressed genes between splenic B-1a cells in control and CKO mice. Each dot in the outer circle represents an individual upregulated (red) or downregulated (blue) gene. Genes of the same functional term are grouped together and the detail of each group is shown in the right table. The colored bars in the inner circle summarize the median folds change of the genes sharing the same functional term. d Heat-map shows the expression levels of listed genes measured by RNA-seq. Each row represents data of an individual gene. Genes with the same functional terms are grouped together. Each column represents data for an individual splenic IgMhi B-1a cell sample from control or CKO mice. All mice are 2–3 months old. Box plots in a, b: box draws 75% (upper), 50% (center line) and 25% (down) quartile, the maxima and minima outliers are shown as top and bottom line, respectively.

