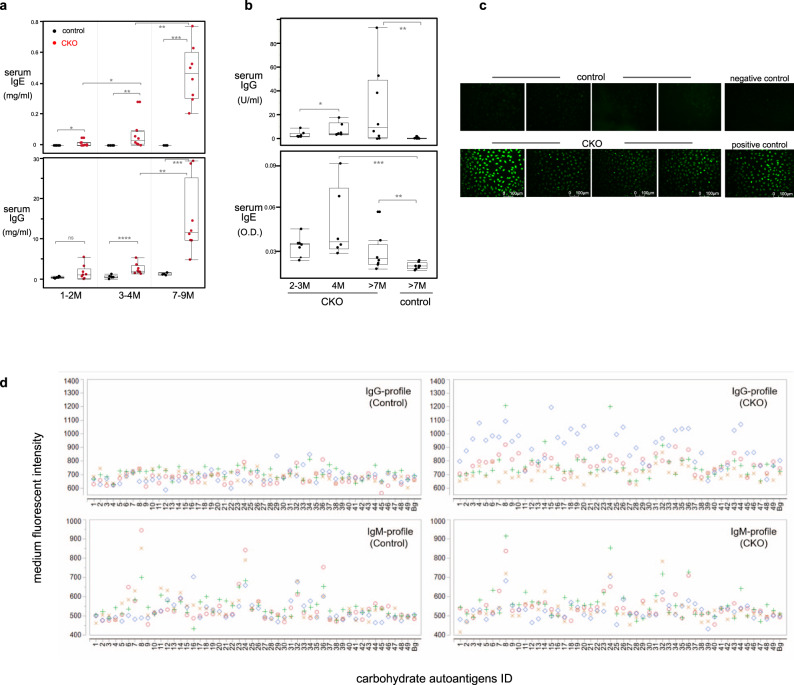
Fig. 4. CKO mouse serum contains autoantibodies to dsDNA, nuclear antigen, and glycan autoantigens.
a IgG and IgE levels in serum of age-indicated control or CKO mice were measured by Elisa, n = 6–8 mice per mouse group, *p < 0.03, **p < 0.001, ***p < 0.006, ****p < 0.002, ns, not significant (p < 0.2), nonparametric Wilcoxon one-way test. b Anti-dsDNA IgG and IgE levels in serum of age-indicated CKO and control mice were measured by Elisa, n = 5–8 mice per mouse group, *p < 0.05, **p < 0.03, ***p < 0.02, nonparametric Wilcoxon one-way test. c Anti-nuclear antigen (ANA) autoantibody in serum of CKO or control mice (7–14 months old) was tested, n = 8 mice per mouse group. Representative data for four mice from each group are shown. None (0/8) of the control mice and 5/8 of CKO mice show positive for ANA. d Anti-glycan IgG and IgM autoantibodies in serum of control or CKO mice were measured by carbohydrate microarray assay. Overlay plots of anti-glycan autoantibody IgG (upper) and IgM (lower) profiles of serum from four control or CKO mice (>7-month-old) are shown. Each symbol represents data of IgG or IgM reacting to an individual glycan antigen for an individual mouse serum. y-axis: the mean values of triplicate microspot detections of individual sera sample for each antigen, x-axis: corresponding ID of glycan antigens. Oligo-mannoses (#8–34), asialo- and aglacto-glycans(#3–6), O-glycan core-based autoantigens (#43–44), Man1Gn2Asn (#8), Man9Gn2Asn (#24), Glc1Man9 (#32), GlcNAc-RB (#36). Information of each glycan antigen is shown in Supplementary Table 6. The mean values of background microspots (Bg) of each staining are shown in the rightmost of X axis in each graph. Box plots in a, b: box draws 75% (upper), 50% (center line), and 25% (down) quartile, the maxima and minima outliers are shown as top and bottom line, respectively.

