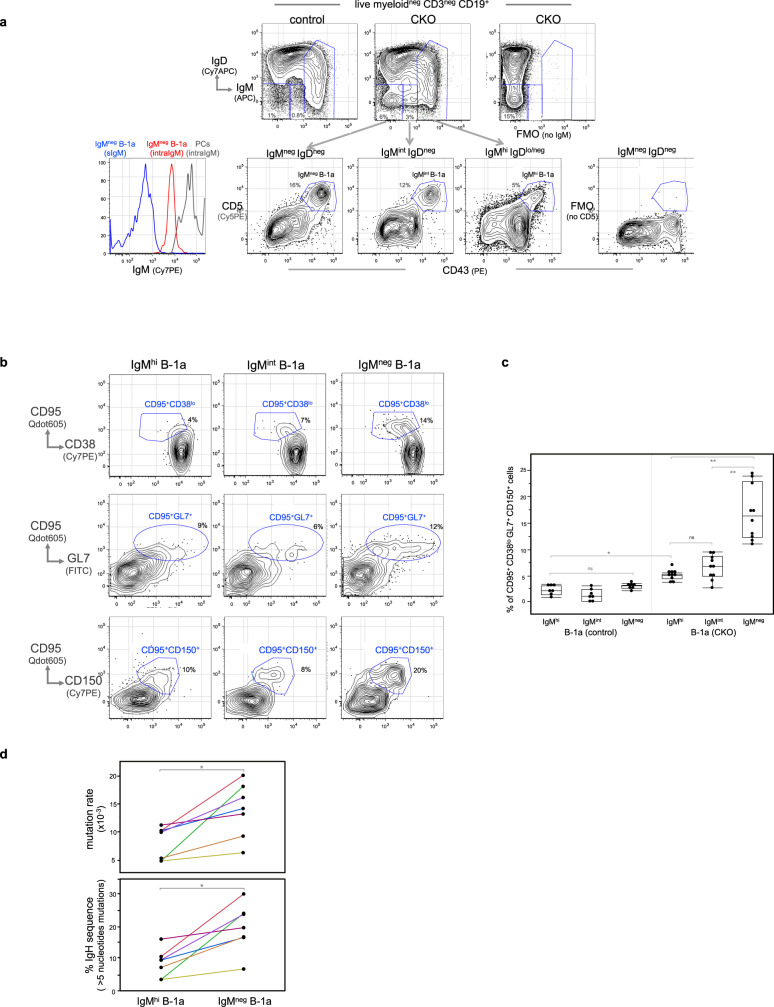
Fig. 5. IgMhi B-1a cells in CKO mice internalize surface IgM and start expressing the pre-GC APC phenotype.
a Live myeloidneg CD3neg CD19+ splenic B cells in control or CKO mice were gated to show IgM and IgD expression. IgMhi IgDlo/neg, IgMint IgDneg, and IgMneg IgDneg B cells in CKO mice were gated to reveal IgMhi, IgMint, and IgMneg B-1a cells, based on CD5 and CD43 expression. Two FMO stainings were used to define IgM and CD5 positive cells. FACS histogram on the left shows the intracellular IgM level in IgMneg B-1a cells (red line) and IgM-secreting PCs (IgDneg CD138+) (gray line). Blue line shows the surface IgM staining level in IgMneg B-1a cells that were stained with anti-IgM antibody before fixation and permibilization. b FACS plots shows cells expressing the differentiated CD95+ CD38lo GL7+ CD150+ phenotype in IgMhi, IgMint, and IgMneg B-1a cells from CKO mice. c Data summarizing the percentage of CD95+ CD38lo GL7+ CD150+ cells in IgMhi, IgMint and IgMneg B-1a cells from control and CKO mice is shown. Each dot represents data for an individual mouse, n = 7–10 mice per subset, *p < 0.001, **p < 0.002, ns, not significant (p < 0.2), nonparametric Wilcoxon one-way test. d IgMhi B-1a and IgMneg B-1a cells from CKO mouse were sorted and then sequenced to obtain their IgH transcripts. Data summarizing the frequencies of IgH sequences containing >5 nucleotide changes and the mutation rate of each sample is shown, n = 7 samples per group with each sample from an individual mouse. Data for IgMhi B-1a and IgMneg B-1a cells from the same mouse are connected. *p < 0.001, nonparametric Wilcoxon one-way test. All mice are 2 months old. Box plots in c, d: box draws 75% (upper), 50% (center line), and 25% (down) quartile, the maxima and minima outliers are shown as top and bottom line, respectively.

