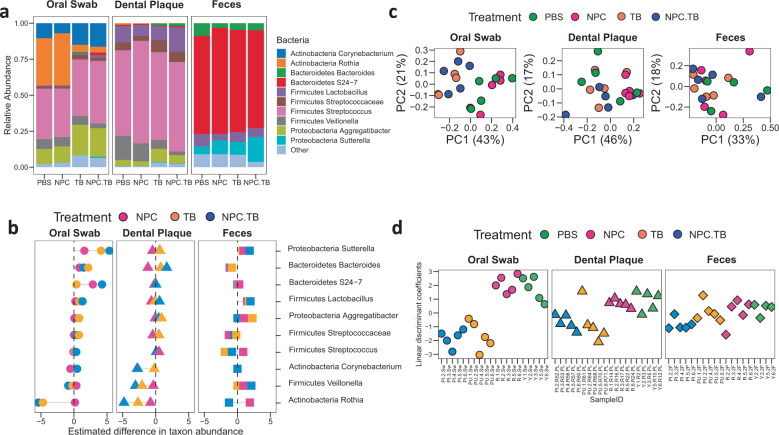
Fig. 3. Effects of repurposed drug treatment on oral and gut microbiomes.
a Bacteria relative abundances within rodent body sites for each treatment group. b Fold change estimate showing main bacterial genera that were differentially abundant between treatment groups against baseline (PBS). c Bray–Curtis principal coordinate analysis for each body site. Color samples correspond to treatment groups. d Linear discriminant coefficients obtained for treatment model. Higher coefficients indicate samples more likely to have non-TB treatments (PBS and NPC groups), while lower numbers indicate samples more likely treated with TB (NPC.TB and TB groups).

