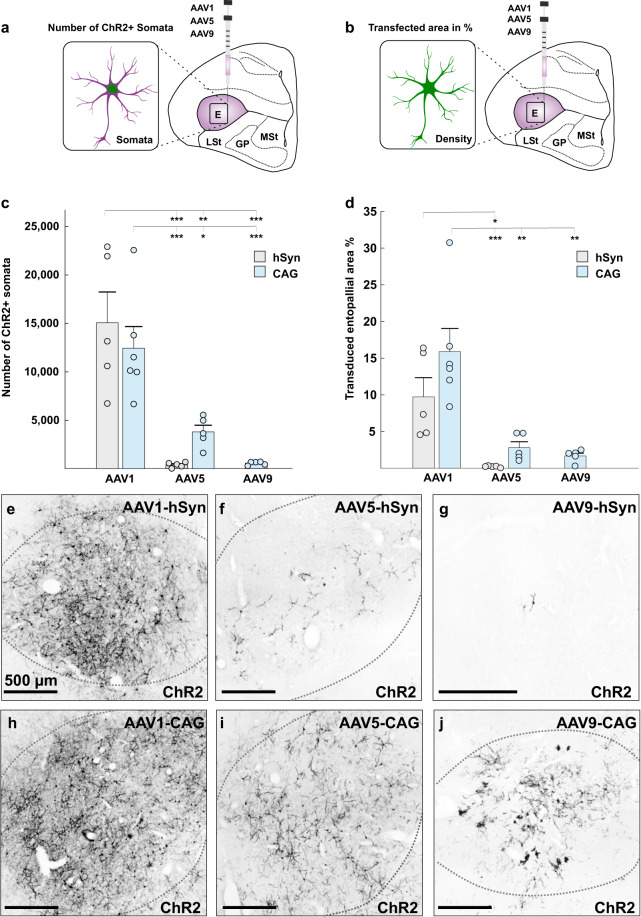
Fig. 1. Comparative transduction analysis of AAV1, AAV5, and AAV9 in combination with the hSyn and CAG promoters.
a Schematic illustration of the injection area and analysis type. For the first analysis, all somata were counted that displayed ChR2 expression. b Schematic illustration of the injection area and the analysis type. For the second analysis, the area of ChR2 expressing somata, dendrites, and axons was measured and compared to the total area of the entopallium. c Quantitative comparison of all tested constructs in their ability to drive transgene expression in somata of the entopallium. AAV1-hSyn-ChR2, as well as AAV1-CAG-ChR2, were significantly more efficient than all other tested constructs. d Percentage of ChR2 expressing entopallial area for all tested constructs. AAV1-CAG was significantly more efficient than all other tested constructs. All AAVs with hSyn promoter are depicted in gray and all AAVs with CAG promoter are depicted in blue. e–j Qualitative pictures of ChR2 expression following injections of e AAV1-hSyn-ChR2 (n = 5), f AAV5-hSyn-ChR2 (n = 5), g AAV9-hSyn-ChR2 (n = 5), h AAV1-CAG-ChR2 (n = 6), i AAV5-CAG-ChR2 (n = 5), and j AAV9-CAG-ChR2 (n = 5). All scale bars represent 500 µm. Error bars represent the standard error of the mean (SEM) and dots represent the raw data, ***p < 0.001, **p < 0.01, *p < 0.05. Abbreviations: AAV adeno-associated viral vector, hSyn human synapsin 1 gene promoter, CAG chicken beta-actin promoter.

