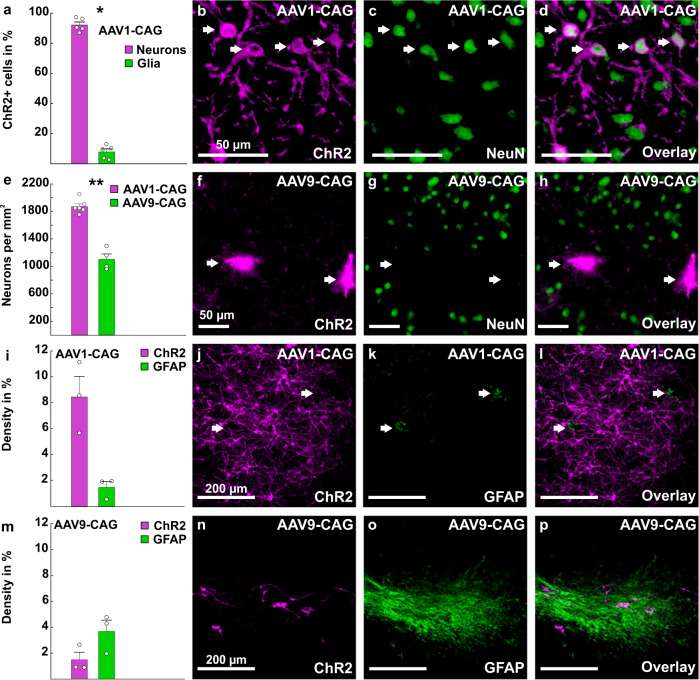
Fig. 4. Cellular tropism of AAV1-CAG and AAV9-CAG.
a–d AAV1-CAG-ChR2 leads to ChR2 expression in significantly more neurons (pink bar) than glial cells (green bar, n = 5 injections). b ChR2 expression after injections of AAV1-CAG. c NeuN expression in the corresponding injection site. d Overlay of ChR2 and NeuN expression. e–h AAV9-CAG (green bar, n = 4 injections) leads to a significant reduction of NeuN in the injection site compared to AAV1-CAG (pink bar, n = 5 injections). f ChR2 expression following injections of AAV9-CAG. g NeuN in the corresponding injection site. h Overlay of ChR2 and NeuN expression indicating that AAV9-CAG injections result in reduced NeuN expression in the injection site. i–l AAV1-CAG leads to extensive ChR2 expression (pink bar), but only to weak GFAP expression (green bar, n = 3 injections). j ChR2 expression following injections of AAV1-CAG-ChR2. k GFAP expression occurs mainly around blood vessels. l Overlay of ChR2 and GFAP expression. m AAV9-CAG injections lead to weak ChR2 expression (pink bar), but increased GFAP expression (green bar, n = 3 injections) in the injection site. n ChR2 expression following injections of AAV9-CAG-ChR2. o GFAP expression within the corresponding injection site. p Overlay of ChR2 and GFAP expression. All scale bars are specified within the microscopic images. Error bars represent the standard error of the mean (SEM), dots represent the raw data. **p < 0.01, *p < 0.05.

