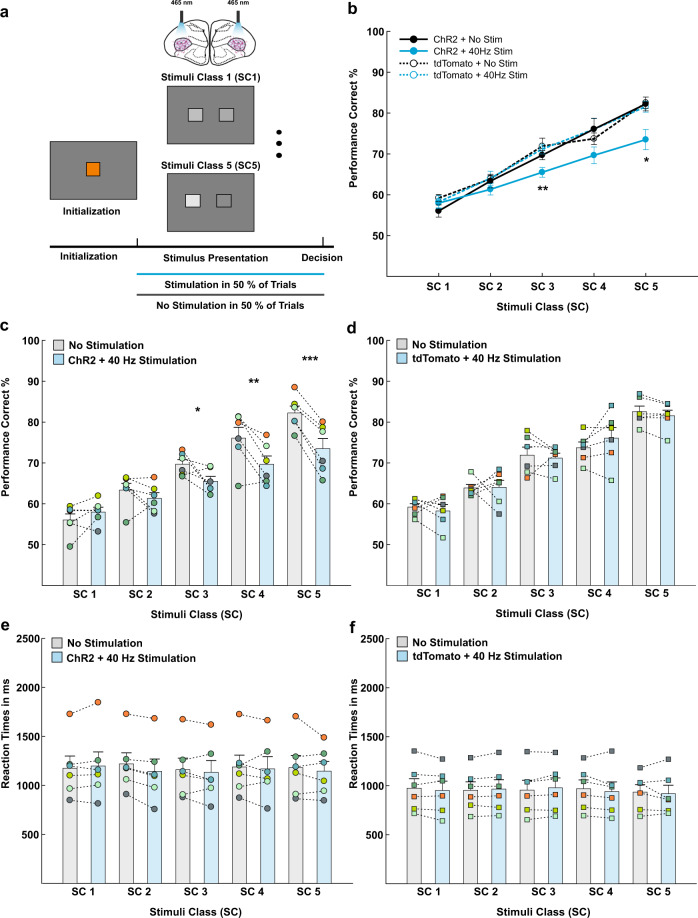
Fig. 7. Transient 40 Hz activation of ChR2 expressing cells in the avian entopallium reduces contrast sensitivity.
a Schematic illustration of the experimental procedure. Pigeons were conditioned to discriminate grayscales of different stimulus classes (SC). SC1 consisted of grayscale pictures that were difficult to discriminate and SC5 consisted of grayscale pictures that were easy to discriminate. Pigeons were bilaterally stimulated in half of the trials in a given session and stimulation took place during the whole stimulus presentation phase or until the animal responded. b Visual discrimination performance of the control (n = 6) and experimental group (n = 6) displayed in one graph. Experimental group data can be seen in more detail in panel (c) and control group data can be seen in more detail in panel (d). The control and experimental group had comparable performances and a significant drop in performance could only be seen for optogenetic stimulation in the experimental group in SC3 and SC5. c Visual discrimination performance of the experimental group expressing ChR2 in the entopallium. Optogenetic stimulation reduced contrast sensitivity as indicated by a significant reduction of discrimination accuracy for stimuli in SC3, SC4, and SC5, but unimpaired discrimination performance in SC2 and SC1. d Visual discrimination performance of the control group expressing tdTomato in the entopallium. Optogenetic stimulation had no effect on contrast sensitivity as discrimination performance was comparable between stimulated and unstimulated trials in all stimulus classes. e, f Reaction times for stimulated and unstimulated trials of the experimental (n = 6) and control group (n = 6). There was no difference in reaction times between the different stimuli classes or between stimulated and unstimulated trials for both groups. c–f Mean performances of all sessions are plotted for all pigeons in individual colors. Stimulated and unstimulated performances within each pigeon have been connected with lines. Error bars represent the standard error of the mean (SEM), ***p < 0.001, **p < 0.01, *p < 0.05.

