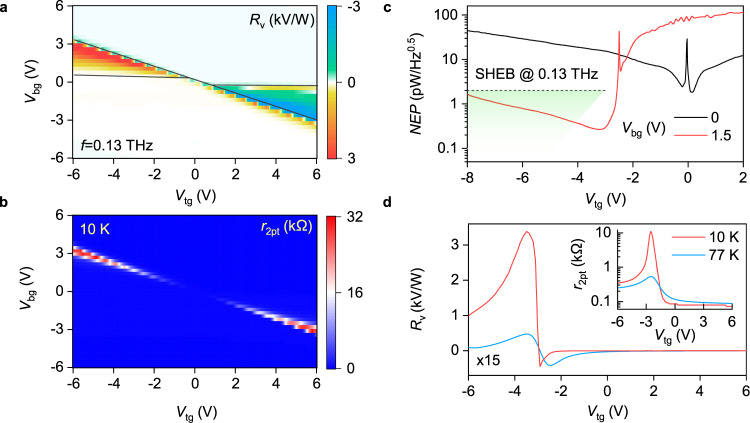
Fig. 3. Performance of the BLG TFET detector.
a Responsivity of our detector as a function of Vbg and Vtg recorded in response to f = 0.13 THz radiation. The black lines demark the (Vtg, Vtg) regions where the tunnel junction configuration is realized. b r2pt(Vtg, Vtg) map measured at T = 10 K. The appearance of highly resistive regions (red) points out to the band gap opening in BLG. c NEP of our detector at given Vbg determined using the Johnson–Nyquist relation for the noise spectral density. Horizontal line marks NEP level for SHEBs operating at the same f and T = 4.2 K (see Supplementary Note 3 for a detailed comparison of the BLG-TFET with other THz detectors). Green shaded region indicates the spread in NEP for SHEBs at higher f. d Temperature dependence of Rv(Vtg) and r2pt(Vtg) (inset) at Vbg = 1.5 V.

