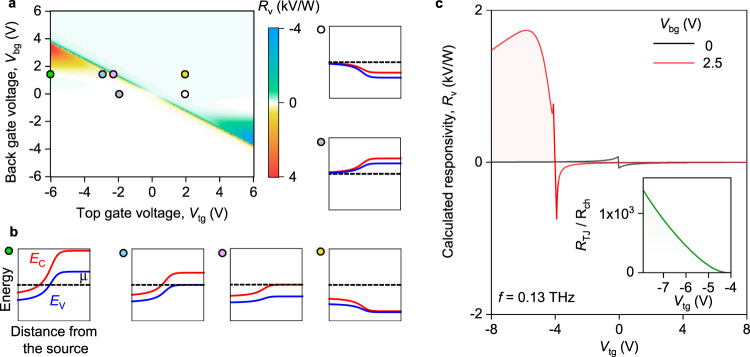
Fig. 4. Modelling tunnelling-assisted THz detection.
a Calculated Rv(Vtg, Vbg) map of our dual-gated BLG device in response to f = 0.13 THz radiation. b Calculated band profiles for different (Vtg, Vbg) configurations indicated by the coloured symbols in a. White, grey, yellow, and pink symbols point to the band diagrams of the FET mode whereas the green and blue symbols correspond to the regime of interband tunnelling. Red, blue, and black lines illustrate conduction band minimum (EC), valence band maximum (EV), and the chemical potential (μ), respectively. c Line cuts of the map in (a) for Vbg = 0 V and Vbg = 2.5 V. The radiation resistance of the antenna Zrad ≈ 75 Ω was used for these calculations (“Methods”). Inset: The ratio between the tunnel junction, RTJ, contribution to the responsivity and that of the channel nonlinearity, Rch, for Vbg = 2.5 V.

