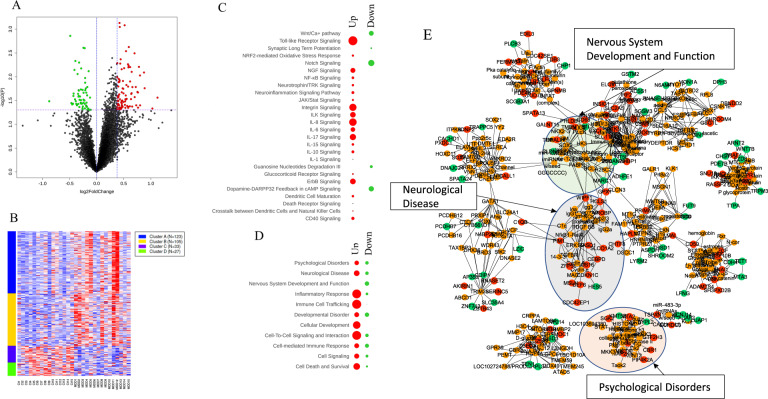
Fig. 2. Volcano plot and heatmap based on synaptic fraction RNA-seq data.
A The Volcano plot was created by all differentially expressed genes (13,236 genes). Y-axis shows the mean expression value of log 10 (p value), and the x-axis displays the log 2 fold change value. The blue vertical line means 1.3-fold change line [log 2 (0.584)]. The purple horizontal line means p = 0.05 [−log 10 (1.30)]. B k-Means clustering was done over heatmap of only significant (p < 0.05) genes made over standard deviation normalization (234 upregulated and 60 downregulated genes). Canonical pathway, disease and function, and gene–gene network were analyzed using 93 upregulated genes (1.3-fold) and all downregulated genes (60 genes). Significant results from canonical pathway (C) and disease and function (D) are shown in red (up) and green (down) circles. Spots/circles size is a function of −log(base = 10) of Fisher’s exact test enrichment p value. E IPA gene–gene network yielded 12 diseases function modules. All 12 subnetwork were merged to build one network. Red nodes represent upregulated genes, whereas green nodes represent downregulated genes. Other genes are presented in orange color. Ct control, MDD major depressive disorder.

